

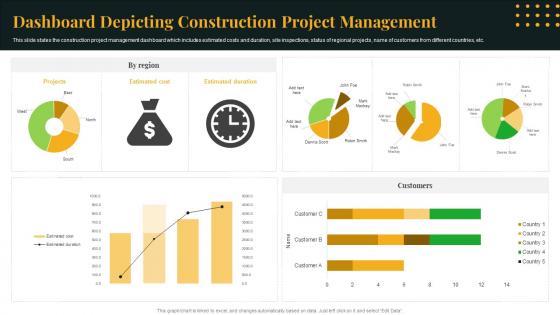
Dashboard Depicting Construction Project Management




Try Before you Buy Download Free Sample Product
 Impress Your
 Audience
 100%
100% Editable
 Save Hours
 of Time


This slide states the construction project management dashboard which includes estimated costs and duration, site inspections, status of regional projects, name of customers from different countries, etc.
People who downloaded this PowerPoint presentation also viewed the following :
Dashboard Depicting Construction Project Management with all 7 slides:
Use our Dashboard Depicting Construction Project Management to effectively help you save your valuable time. They are readymade to fit into any presentation structure.





FAQs for Dashboard Depicting
Construction dashboards should include project progress percentage, budget variance, schedule adherence, safety incident rates, resource utilization, and cost per square foot. These KPIs enable project managers to streamline operations by identifying bottlenecks, controlling expenses, and maintaining safety standards, with many construction firms finding that real-time visibility ultimately delivers improved project outcomes and competitive advantage.
A construction dashboard improves project management efficiency by centralizing real-time data, automating progress tracking, and enabling instant visibility across all project phases, from resource allocation to timeline management. Through integrated analytics, construction managers streamline decision-making, minimize delays, and enhance coordination between teams, ultimately delivering projects faster while reducing costs and improving stakeholder communication.
**INPUT**: What tools and software are best suited for creating construction dashboards? **OUTPUT**: Construction dashboard tools include Microsoft Power BI, Tableau, Procore, Autodesk Construction Cloud, and Smartsheet, each offering specialized project tracking capabilities. These platforms streamline operations by integrating scheduling data, budget monitoring, and resource allocation, with many construction firms finding that real-time visibility ultimately delivers faster project completion and enhanced stakeholder communication. *[Word count: 54 words]*
Real-time data integration into construction dashboards involves connecting IoT sensors, project management software, GPS tracking systems, and financial platforms through APIs and cloud-based solutions. This enables construction managers to monitor equipment utilization, labor productivity, material deliveries, and budget variances simultaneously, ultimately delivering faster project adjustments and improved resource allocation across multiple job sites.
Visualizations in construction dashboards enhance project monitoring by transforming complex data into easily interpretable graphs, charts, and visual indicators that highlight progress, resource allocation, safety metrics, and budget tracking. These visual tools enable project managers and stakeholders to quickly identify bottlenecks, cost overruns, and scheduling delays, ultimately delivering faster decision-making and improved project outcomes across construction sites.
Construction dashboards help track project timelines and budgets by providing real-time visibility into schedule progress, cost expenditures, resource allocation, and milestone achievements through centralized data visualization. These platforms enable project managers to identify delays, monitor budget variances, and forecast completion dates, with many construction firms finding that dashboard analytics significantly reduce project overruns and enhance stakeholder communication.
Mobile dashboards enable real-time on-site decision making by providing instant access to project schedules, resource allocation, safety protocols, quality metrics, and budget tracking directly from the field. Through smartphone and tablet integration, construction managers can update progress, report issues, and coordinate teams seamlessly, while contractors increasingly find that mobile accessibility reduces delays and enhances communication between field operations and project headquarters.
Users customize construction dashboards by selecting relevant KPIs, configuring real-time data feeds, creating role-based access controls, and integrating project-specific metrics like budget tracking and timeline milestones. These customizable features enable project managers, contractors, and stakeholders to monitor critical aspects while streamlining communication and decision-making processes, ultimately delivering enhanced project visibility and operational efficiency.
Common pitfalls include overloading dashboards with unnecessary metrics, poor data visualization choices, lack of real-time integration, and ignoring user-specific needs. These design flaws can overwhelm project managers and contractors, ultimately reducing decision-making efficiency rather than enhancing it, with many construction firms finding that simplified, role-based dashboards deliver better project outcomes.
Construction dashboards enhance risk management by providing real-time visibility into safety incidents, budget variances, schedule delays, weather impacts, and equipment failures. Through automated alerts and predictive analytics, project managers can identify potential issues early, implement preventive measures, and coordinate rapid responses, with many construction firms finding that proactive dashboard monitoring reduces project risks by 30-40% while improving overall safety outcomes.
Construction dashboards enhance stakeholder engagement by providing real-time project visibility, automated progress reporting, centralized communication channels, interactive budget tracking, and milestone notifications. These features streamline collaboration between contractors, clients, architects, and investors, with many construction firms finding that transparent data sharing reduces disputes, accelerates decision-making, and ultimately delivers stronger project relationships and improved client satisfaction.
Ensuring data accuracy in construction dashboards requires automated data integration, real-time validation protocols, standardized input formats, regular auditing processes, and cross-platform verification systems. Through IoT sensors and project management software integration, construction teams streamline data collection, minimize manual entry errors, and establish consistent reporting standards, ultimately delivering reliable insights that enhance project decision-making and operational efficiency.
Key performance metrics for contractor performance include project completion rates, budget adherence, safety incident tracking, quality scores, and schedule variance analysis. These metrics enable project managers to monitor cost overruns, timeline delays, and safety compliance across multiple sites, with many construction firms finding that real-time visibility ultimately enhances accountability and streamlines contractor relationships.
A construction dashboard facilitates collaboration by providing real-time project visibility, centralized communication channels, shared document access, task coordination tools, and integrated progress tracking across all teams. These platforms enable architects, contractors, and project managers to streamline workflows, reduce miscommunication, and accelerate decision-making, with many construction firms finding that centralized dashboards ultimately deliver improved project timelines and enhanced operational efficiency.
Future trends in construction dashboard development include AI-powered predictive analytics, IoT sensor integration, mobile-first interfaces, real-time collaboration tools, and advanced data visualization capabilities. These innovations streamline project management by enhancing decision-making speed, improving resource allocation, and enabling proactive issue resolution, with many construction firms finding that integrated dashboard solutions ultimately deliver significant cost reductions and competitive advantages.
-
Wonderful templates design to use in business meetings.
-
Presentation Design is very nice, good work with the content as well.