


Dashboard For Big Data Management Big Data Analytics And Management





Try Before you Buy Download Free Sample Product
 Impress Your
Audience
 100%
Editable
 Save Hours
of Time


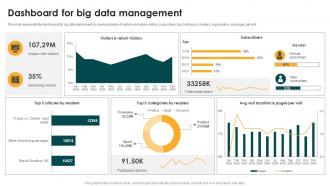
This slide represents the dashboards for big data deployment by covering details of visitors and return visitors, subscribers, top 3 articles by readers, avg duration, and pages per visit.
People who downloaded this PowerPoint presentation also viewed the following :
Dashboard For Big Data Management Big Data Analytics And Management with all 10 slides:
Use our Dashboard For Big Data Management Big Data Analytics And Management to effectively help you save your valuable time. They are readymade to fit into any presentation structure.








FAQs for Dashboard For Big Data Management Big Data
Focus on metrics that actually matter for your business - conversion rates, user engagement, revenue trends, that kind of stuff. Real-time data helps with urgent decisions. Historical trends let you spot patterns over time. Honestly, most dashboards I've seen are just metric overload and nobody uses half of them. Set up alerts for weird spikes or drops. Make everything filterable by location, product type, whatever makes sense for you guys. Oh, and include some operational stuff like system performance if that's relevant. Start with maybe 5-7 metrics your team will actually check daily, then add more later.
Look, real-time dashboards are a total game changer - you'll catch problems while you can actually fix them instead of finding out way too late. I've watched teams spot revenue drops in hours rather than weeks, which honestly saved their asses. Your dashboard becomes this live snapshot instead of some boring historical report. Customer behavior, operational issues, market changes - you see it all happening. The trick is setting up smart alerts for what actually matters to your business goals. Otherwise you're just watching pretty charts that don't do anything for you.
Honestly, I'd go with **Tableau** or **Power BI** first - they're popular because they actually work well with big datasets. The drag-and-drop stuff is pretty intuitive. **Looker**'s great if your team knows their way around data. **Apache Superset** is free and does way more than you'd expect, but yeah, setup's a pain. Oh, and **Qlik Sense** has this cool exploration thing that's really smooth once you get the hang of it. Just grab free trials of Tableau and Power BI though. Whichever one doesn't make you want to throw your laptop wins.
Here's the thing - your dashboard will actually work if you put the most important stuff where people expect to find it. Interview some real users first (seriously, this step saves so much headache later). Figure out their daily workflow instead of cramming every metric you can think of onto one screen. Use plenty of whitespace so it doesn't look like a spreadsheet from hell. Color coding helps, but keep it consistent. Navigation should feel obvious, not like solving a puzzle. Short version: design for how people's brains actually work, not for impressing your data team.
First things first - get your data formats consistent across all sources. Naming conventions, schemas, the whole deal. ETL pipelines are your friend for cleaning stuff as it comes in. Real-time connectors beat batch uploads every time (seriously, nobody wants yesterday's data). A data lake or warehouse works way better than hitting APIs directly from your dashboard - learned that one the hard way. Oh, and document your data lineage! You'll thank me later when something breaks at 2am. Start small with sample datasets to test everything first.
Honestly, you've gotta build validation into every step of your pipeline or you'll get burned. I learned this when execs made huge calls off bad data - total nightmare. Start at the source, then add automated checks for missing values, weird outliers, format issues, all that stuff. Real-time alerts are clutch so you catch problems fast. Oh and set up data lineage tracking too - sounds fancy but it just means you can trace issues back to where they started. Way easier than scrambling to fix things after your dashboard's already showing garbage data.
So data storytelling is what makes your dashboard actually usable instead of just a hot mess of random charts. You're basically walking people through what happened and why they should care - like being a tour guide instead of throwing a map at someone and bolting. I always tell people to figure out the main story first, then arrange your panels so users can follow along naturally. Short answer: organize everything in a logical flow that builds understanding step by step. Otherwise people just stare at your beautiful visualizations and have no clue what to do next.
Honestly, the best approach is talking to each team first - find out what they actually need day-to-day. Executives want the big picture stuff, KPIs and trends. Your tech team needs all the nitty-gritty operational details with drill-down options. Set up role-based views so everyone sees what matters to them. Most dashboards let you control permissions too, which is clutch for keeping sensitive data locked down. Don't forget filtering and custom time ranges - people love tweaking that stuff. Oh, and marketing will definitely want completely different metrics than finance, so plan for that variety upfront.
Oh man, you're gonna hit some brutal performance issues first. Dashboard queries that used to be snappy? They'll suddenly crawl to a painful death when stakeholders are breathing down your neck. Memory becomes a nightmare too - try loading too much data and watch everything crash. Your visualizations will lag like crazy or just timeout completely. Start by profiling your slowest queries (trust me on this one), then add proper indexing and smart data sampling. Real-time streaming beats batch processing here. It's honestly a mess until you get the architecture right.
Connect your ML models straight to the data pipeline and they'll predict stuff in real-time as fresh data comes through. Set up automated training on your historical data first. Then show predictions as forecast charts or alert widgets - honestly, sales forecasting dashboards look pretty slick when done right. Use APIs or something like Kafka to stream live data into your models. Display those outputs next to your regular metrics so you can actually see what's happening. Start simple with regression models though. You can get fancy with deep learning once the basic setup works.
Honestly, you gotta stack different security layers - don't rely on just one thing. Role-based access is your foundation so people only see what they need. MFA is annoying but totally worth it. Encrypt everything, seriously - data moving around AND stored data. I can't tell you how many companies skip this step and regret it later. Oh, and set up audit logs to track who's poking around in your data. For dev environments, mask that sensitive stuff. Think of it like locking your house - you want multiple locks, not just hoping that flimsy chain latch does the job.
Honestly, cloud makes Big Data dashboards so much simpler. You don't need to buy servers or stress about scaling - just use AWS, Azure, or Google Cloud on-demand. The managed services like BigQuery and Redshift do all the heavy lifting for you. When usage spikes (goodbye crashed dashboards during Monday exec meetings), everything scales automatically. Deployment's way faster since it's pre-configured. I'd definitely start with their dashboard templates first - you'll be shocked how much time you save vs setting up on-premise stuff. Game changer, seriously.
Honestly, mobile access is huge because you can check your most important numbers anywhere. Client meetings, airports, wherever. Those real-time alerts hit different when you can actually act on them right away instead of waiting until you're back at your computer. I can't tell you how many times I've been stuck without the data I needed - super awkward. You can screenshot stuff for your team instantly too. My advice? Figure out your top 3-5 metrics first and make sure they look decent on your phone. Everything else can wait.
Dude, real-time streaming analytics is where it's at right now. Plus AI that actually predicts stuff instead of just telling you what already happened. Business users are obsessed with building their own dashboards - they don't want to wait for IT anymore. Natural language querying is pretty wild too, like you can just say "show me sales by region" and boom, it works. Oh, and everyone's checking dashboards on their phones now so mobile design isn't optional anymore. Definitely mess around with automated anomaly detection though. Your team will thank you for not having to hunt down weird data points every single week.
Honestly, just make it super easy for people to give you feedback or they won't bother. Those little thumbs up/down widgets in your dashboard are surprisingly effective - way better than I thought they'd be. Do separate interviews with your heavy users vs casual ones since they want completely different things. Surveys are fine but keep them stupidly short. The frustrated users will always find a way to complain, but you're missing out on insights from everyone else if there's too much friction. I'd start with the dashboard widgets since they're quick to set up.
-
No second thoughts when I’m looking for excellent templates. SlideTeam is definitely my go-to website for well-designed slides.
-
If you have visited their site and failed to find the products, try reaching the customer service because it will be the case that you didn't use the search bar well.