

Dashboard Snapshot For Personalized Digital Marketing KPIS Ppt Ideas Pictures




Try Before you Buy Download Free Sample Product
 Impress Your
 Audience
 100%
100% Editable
 Save Hours
 of Time


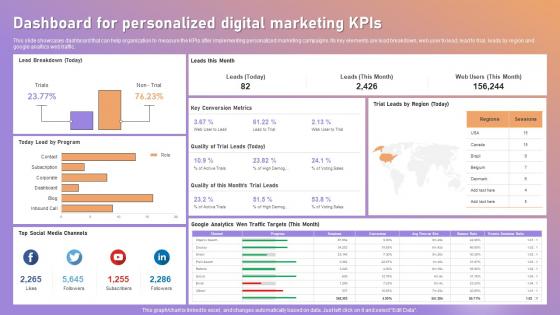
This slide showcases dashboard that can help organization to measure the KPIs after implementing personalized marketing campaigns. Its key elements are lead breakdown, web user to lead, lead to trial, leads by region and google analtics web traffic.
People who downloaded this PowerPoint presentation also viewed the following :
Dashboard Snapshot For Personalized Digital Marketing KPIS Ppt Ideas Pictures with all 7 slides:
Use our Dashboard For Personalized Digital Marketing KPIS Ppt Ideas Pictures to effectively help you save your valuable time. They are readymade to fit into any presentation structure.





FAQs for Dashboard Snapshot For Personalized Digital Marketing KPIS
Essential KPIs for personalized digital marketing dashboards include customer acquisition cost, lifetime value, conversion rates, engagement metrics, and return on ad spend. These metrics enable marketers to track campaign performance, optimize resource allocation, and measure ROI across channels, with many organizations finding that personalized dashboards ultimately deliver faster decision-making and improved marketing efficiency.
Data visualization enhances digital marketing performance understanding by transforming complex datasets into intuitive charts, graphs, and interactive dashboards that reveal patterns, trends, and correlations instantly. Through visual analytics, marketing teams streamline campaign analysis, identify high-performing channels, and optimize budget allocation more effectively, with many organizations finding that visual dashboards accelerate decision-making and ultimately deliver improved ROI across their digital initiatives.
Effective dashboard snapshot tools include Tableau, Power BI, Google Data Studio, Looker, and Qlik Sense, which streamline data visualization through drag-and-drop interfaces, real-time integration, and customizable templates. These platforms enhance marketing performance monitoring by automating KPI tracking, enabling cross-channel analytics, and delivering personalized insights, with many digital marketing teams finding that interactive dashboards ultimately accelerate decision-making and improve campaign optimization.
Measuring personalized marketing effectiveness requires tracking engagement rates, conversion rates, customer lifetime value, return on ad spend, and click-through rates across segmented audiences. These KPIs enable marketers to assess campaign performance by comparing personalized versus generic content results, analyzing individual customer journey progression, and identifying high-value segments, ultimately delivering enhanced ROI and deeper customer relationships.
Traditional digital marketing KPIs focus on broad metrics like overall traffic, conversion rates, and aggregate engagement across entire campaigns or audiences. Personalized digital marketing KPIs track individual customer behaviors, segment-specific performance, lifetime value predictions, and real-time personalization effectiveness, enabling businesses to optimize customer experiences at scale and deliver significantly higher ROI through targeted strategies.
Digital marketing dashboards should be updated continuously for real-time metrics like website traffic and social engagement, with comprehensive performance reviews conducted daily or weekly depending on campaign intensity. This approach enables marketers to quickly identify trending content, adjust ad spend allocation, and respond to customer behavior shifts, while weekly reviews provide strategic insights for optimizing ROI and competitive positioning.
Customer segmentation plays a crucial role in determining relevant KPIs by enabling marketers to identify distinct audience groups based on demographics, behavior, preferences, and purchase patterns, allowing for targeted metric selection. Through strategic segmentation, organizations can track conversion rates by segment, personalized content engagement scores, and segment-specific lifetime value, ultimately delivering more precise marketing ROI measurements and enhanced customer experiences across diverse audience groups.
A/B testing data integrates effectively into dashboards through automated data feeds, real-time performance comparisons, statistical significance indicators, and conversion funnel visualizations that highlight winning variations. These dashboard elements streamline decision-making by presenting test results alongside campaign metrics, customer segmentation data, and revenue attribution, with many marketing teams finding that consolidated A/B insights accelerate optimization cycles and enhance ROI.
User experience significantly impacts dashboard snapshot interpretation through intuitive design, clear data visualization, accessible navigation, and responsive layouts that minimize cognitive load. When dashboards prioritize user-centered design principles, marketing teams can quickly identify KPI trends, spot performance anomalies, and make data-driven decisions more efficiently, with many organizations finding that well-designed interfaces reduce analysis time and improve strategic responsiveness.
KPI prioritization varies by channel objectives, with social media focusing on engagement rates and reach, email emphasizing open rates and conversion metrics, and SEO tracking organic traffic and keyword rankings. Strategic marketers align channel-specific KPIs with broader business goals, measuring cost-per-acquisition across paid channels while monitoring lifetime value ratios, ultimately creating integrated dashboards that reveal cross-channel attribution and optimize resource allocation for maximum ROI.
Predictive analytics in digital marketing dashboards can be represented through forecasted conversion rates, projected customer lifetime value graphs, lead scoring visualizations, churn probability indicators, and revenue prediction models. These visual elements enable marketers to anticipate campaign performance, identify high-value prospects, and optimize resource allocation proactively, with many organizations finding that predictive insights ultimately streamline decision-making and enhance ROI across channels.
Click-through rates, time spent on personalized content, conversion rates, email open rates, and social media interactions are most indicative of customer engagement in personalized campaigns. These metrics work together to reveal customer behavior patterns, with many retail and e-commerce organizations finding that combining these engagement indicators delivers deeper insights into campaign effectiveness and ultimately enhances ROI.
Marketing dashboards can be customized by role, with executives viewing high-level ROI metrics and campaign performance, managers tracking team productivity and budget allocation, and specialists monitoring channel-specific KPIs like conversion rates and engagement metrics. Through personalized data visualization and automated reporting features, these tailored dashboards enable faster decision-making, improved accountability, and enhanced strategic alignment across marketing teams.
Best practices for KPI reporting include using clean, consistent visual hierarchies, color-coding performance indicators, implementing interactive dashboards, incorporating real-time data updates, and strategically placing key metrics above the fold. These approaches enhance stakeholder comprehension by minimizing cognitive load, enabling quick pattern recognition, and facilitating data-driven decision making, with many marketing teams finding that well-designed visual reports increase engagement rates and accelerate campaign optimization cycles.
Ensuring data accuracy across marketing dashboards requires implementing standardized data collection protocols, regular validation checks, automated integration systems, and consistent metric definitions throughout all platforms. Through centralized data management and real-time synchronization tools, organizations streamline reporting processes while minimizing manual errors, ultimately delivering reliable insights that enhance strategic decision-making and competitive advantage.
-
SlideTeam is my one-stop solution for all the presentation needs. Their templates have beautiful designs that are worth every penny!
-
The designs are very attractive and easy to edit. Looking forward to downloading more of your PowerPoint Presentations.