

Dashboard Showcasing Staff Headcount And Recruitment Budget Assessment





Try Before you Buy Download Free Sample Product
 Impress Your
Audience
 100%
Editable
 Save Hours
of Time


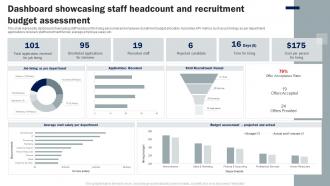
This slide represents dashboard showcasing staff headcount for hiring personnel and employee recruitment budget allocation. It provides KPI metrics such as job hirings as per department, applications received, staff recruitment funnel, average employee salary etc.
People who downloaded this PowerPoint presentation also viewed the following :
Dashboard Showcasing Staff Headcount And Recruitment Budget Assessment with all 7 slides:
Use our Dashboard Showcasing Staff Headcount And Recruitment Budget Assessment to effectively help you save your valuable time. They are readymade to fit into any presentation structure.






FAQs for Dashboard Showcasing Staff Headcount And
**INPUT**: What are the key components of an effective dashboard design? **OUTPUT**: Effective dashboard design includes intuitive navigation, clear data visualization, real-time metrics, customizable filters, and responsive layouts that adapt across devices. These components streamline decision-making by presenting actionable insights, reducing information overload, and enabling stakeholders to quickly identify trends, with many organizations finding that well-designed dashboards ultimately enhance operational efficiency and accelerate strategic responses.
Visual hierarchy improves dashboard readability by organizing information through size, color, contrast, positioning, and typography to guide users' attention naturally. These design principles streamline data consumption by highlighting critical metrics first, grouping related elements effectively, and creating clear scanning patterns, ultimately delivering faster decision-making and enhanced user experiences across organizations.
Interactivity transforms static dashboards into dynamic exploration tools by enabling drill-downs, filtering, real-time updates, and personalized views that encourage deeper data analysis. Through interactive features like clickable charts and dynamic filtering, organizations streamline decision-making processes, enhance user adoption rates, and ultimately deliver more meaningful insights, with many businesses finding that interactive dashboards significantly improve operational efficiency and strategic planning outcomes.
Effective dashboard color schemes include sequential blues or greens for continuous data, diverging red-to-blue palettes for comparative analysis, and categorical schemes using distinct hues for different data series. These strategic combinations enhance data comprehension by reducing cognitive load, improving pattern recognition, and enabling faster decision-making, with many organizations finding that thoughtful color choices increase dashboard adoption rates significantly.
Dashboards can be tailored through customizable layouts, role-based access controls, varying data complexity levels, interactive filtering options, and personalized visualization formats. Organizations achieve this by creating executive summaries for leadership, detailed operational views for managers, and simplified interfaces for frontline staff, ultimately delivering relevant insights while enhancing user adoption across skill levels.
Streaming APIs, database triggers, IoT sensors, web analytics platforms, and cloud-based data warehouses are ideal for real-time dashboard updates. These sources enable continuous data flow through automated feeds, webhooks, and live connections, with many organizations finding that combining multiple sources delivers comprehensive visibility, faster decision-making, and enhanced operational responsiveness.
Storytelling enhances dashboard presentations through narrative frameworks, sequential data reveals, contextual annotations, progressive disclosure techniques, and compelling visual hierarchies. These approaches transform static metrics into engaging experiences by guiding viewers through logical progressions, highlighting key insights with explanatory context, and connecting data points to business outcomes, ultimately delivering more persuasive presentations and actionable insights.
Common dashboard design mistakes include cluttered layouts, irrelevant metrics, poor visual hierarchy, inconsistent formatting, and lack of user-focused design. These pitfalls undermine data clarity and decision-making effectiveness, with many organizations finding that streamlined dashboards featuring key performance indicators, intuitive navigation, and role-specific customization ultimately deliver better insights and faster strategic responses.
Dashboards help track KPIs effectively by centralizing data visualization, providing real-time updates, enabling customizable metrics displays, and offering automated alerts for performance thresholds. Through interactive charts and consolidated reporting, organizations streamline performance monitoring across departments, while executives gain immediate visibility into revenue trends, operational efficiency, and customer satisfaction metrics, ultimately delivering faster decision-making and enhanced accountability.
Dashboard templates offer significant time savings, design consistency, professional aesthetics, reduced development costs, and faster deployment across organizations. These pre-built frameworks streamline creation by eliminating repetitive design work, ensuring brand alignment, and providing proven layouts, with many businesses finding that templates accelerate their analytics initiatives while maintaining visual standards and operational efficiency.
Mobile responsiveness in dashboard designs is ensured through flexible grid systems, scalable typography, touch-friendly interfaces, adaptive layouts, and progressive disclosure techniques. These approaches streamline user experiences by prioritizing critical metrics, optimizing navigation for smaller screens, and maintaining functionality across devices, with many organizations finding that responsive dashboards significantly enhance accessibility and user engagement.
**INPUT**: What data visualization tools are recommended for building dynamic dashboards? **OUTPUT**: Recommended data visualization tools for dynamic dashboards include Tableau, Power BI, D3.js, Plotly, and Google Data Studio, each offering distinct capabilities for interactive reporting. These platforms streamline dashboard creation by enabling real-time data connections, customizable visualizations, and automated updates, with many organizations finding that strategic tool selection ultimately delivers enhanced decision-making speed and operational efficiency. [Word count: 58 words]
User feedback and testing contribute to optimizing dashboard design by identifying usability gaps, revealing user behavior patterns, and highlighting critical information needs that designers might overlook. Through iterative testing cycles, organizations streamline interface layouts, enhance data visualization clarity, and improve navigation workflows, with many companies finding that user-centered design approaches ultimately deliver more intuitive dashboards and higher adoption rates.
**INPUT**: What trends are shaping the future of dashboard design in data analytics? **OUTPUT**: Key trends include AI-powered insights, interactive visualizations, real-time data streaming, mobile-first design, and personalized user experiences. These innovations enhance decision-making by automating pattern recognition, enabling deeper data exploration, and delivering instant accessibility, with organizations across retail, healthcare, and finance finding that modern dashboards significantly streamline operations while improving strategic responsiveness. [Word count: 56 words]
Dashboards support organizational decision-making by centralizing key metrics, visualizing trends, and providing real-time data access across departments. Through interactive analytics and customizable views, executives can identify performance gaps, monitor operational efficiency, and respond quickly to market changes, with many organizations finding that consolidated data visualization accelerates strategic planning and improves resource allocation decisions.
-
Understandable and informative presentation.
-
I want to thank SlideTeam for the work that they do, especially their customer service.