


Dashboard To Track Reporting And Billing Time Automation For Customer Database




Try Before you Buy Download Free Sample Product
 Impress Your
 Audience
 100%
100% Editable
 Save Hours
 of Time


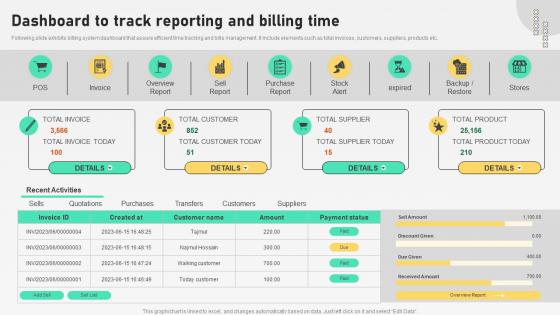
Following slide exhibits billing system dashboard that assure efficient time tracking and bills management. It include elements such as total invoices, customers, suppliers, products etc.
People who downloaded this PowerPoint presentation also viewed the following :
Dashboard To Track Reporting And Billing Time Automation For Customer Database with all 10 slides:
Use our Dashboard To Track Reporting And Billing Time Automation For Customer Database to effectively help you save your valuable time. They are readymade to fit into any presentation structure.








FAQs for Dashboard To Track Reporting And Billing Time Automation
Dashboard automation delivers enhanced data accuracy, real-time insights, reduced manual errors, faster decision-making, and improved resource allocation across organizations. These technologies streamline operations by eliminating repetitive reporting tasks, enabling continuous monitoring, and providing instant alerts, with many financial services and retail companies finding that automated dashboards significantly reduce analysis time while delivering more consistent, actionable intelligence for strategic planning.
Dashboard automation improves decision-making by providing real-time data visualization, eliminating manual reporting delays, and ensuring consistent data accuracy across departments. Through automated analytics, organizations streamline information flow, reduce human error, and enable faster strategic responses, with many financial services and healthcare institutions finding that automated dashboards deliver significantly improved operational efficiency and competitive advantage.
Popular dashboard automation tools include Tableau, Power BI, Qlik Sense, Google Data Studio, and Looker, which streamline data visualization and reporting processes. These platforms enhance operational efficiency by automating data refresh, generating real-time insights, and enabling self-service analytics, with many organizations finding that automated dashboards significantly reduce manual reporting time while delivering faster decision-making capabilities.
Real-time data integration enhances automated dashboards by providing instant access to current information, eliminating data delays, and enabling immediate decision-making across organizations. Through continuous data streams, businesses achieve faster response times, improved operational visibility, and proactive issue resolution, with many financial institutions and manufacturing companies finding that real-time insights ultimately deliver significant competitive advantages.
Organizations face challenges including data integration complexities, resistance to change from stakeholders, ensuring data quality and accuracy, managing security protocols, and balancing automation with customization needs. While these hurdles can initially slow implementation, many companies find that strategic planning, phased rollouts, and comprehensive training ultimately streamline operations and enhance decision-making capabilities across departments.
Businesses can ensure automated dashboard security through encryption, role-based access controls, regular security audits, multi-factor authentication, and data masking techniques. These measures enable organizations to protect sensitive information while maintaining operational efficiency, with many financial services and healthcare institutions finding that strategic security frameworks ultimately deliver both compliance adherence and competitive advantage.
User interface design significantly impacts automated dashboard effectiveness by determining data accessibility, visual clarity, navigation intuitiveness, and user engagement levels. Well-designed interfaces streamline decision-making processes through clear data visualization, responsive layouts, and customizable views, with many organizations finding that intuitive dashboard designs reduce training time, increase user adoption, and ultimately deliver faster insights and improved operational efficiency.
Automated dashboards can be customized through role-based access controls, department-specific KPIs, tailored data filters, personalized visualizations, and custom alert thresholds. Through modern dashboard platforms, finance teams focus on budget metrics while marketing tracks campaign performance and operations monitors efficiency indicators, ultimately delivering relevant insights that enhance decision-making across departments.
Organizations should track metrics including time saved on manual reporting, data accuracy improvements, user adoption rates, decision-making speed, and cost reduction from streamlined processes. These metrics enable businesses to measure ROI through faster insights, reduced operational overhead, and enhanced productivity, with many companies finding that automated dashboards deliver 60-70% faster reporting cycles and significantly improved strategic decision-making capabilities.
Machine learning enhances dashboard automation by enabling predictive analytics, intelligent data filtering, automated anomaly detection, and dynamic visualization adjustments based on user behavior patterns. Through AI-driven insights, organizations streamline reporting processes, reduce manual intervention, and deliver personalized dashboard experiences, with many financial services and retail companies finding significantly improved decision-making speed and operational efficiency.
Automated dashboards support remote work by providing real-time visibility into team performance, project progress, centralized data access, and automated status updates across distributed teams. These systems enable remote managers to monitor productivity metrics, track deliverables, and maintain operational oversight without constant check-ins, while team members access consistent information seamlessly, ultimately delivering enhanced collaboration and accountability.
Best practices for maintaining automated dashboards include establishing regular data validation schedules, implementing version control systems, monitoring data source reliability, conducting periodic user feedback sessions, and documenting all changes comprehensively. These practices streamline dashboard performance by ensuring accuracy, reducing downtime, and enhancing user experience, with many organizations finding that systematic maintenance ultimately delivers improved decision-making capabilities and sustained competitive advantage.
Automation significantly reduces time spent on data visualization by eliminating manual data collection, automatically updating charts and graphs, and streamlining report generation processes. Through automated dashboards, organizations can transform hours of manual work into real-time insights, with many financial services and retail companies finding that automation delivers faster decision-making and improved operational efficiency.
Industries with complex data workflows benefit most from dashboard automation, including healthcare, financial services, manufacturing, retail, and logistics. These sectors leverage automated dashboards to streamline reporting processes, enhance real-time decision-making, and minimize manual data compilation, with many organizations finding that dashboard automation delivers faster insights, improved operational efficiency, and significant competitive advantages.
End-user feedback informs automated dashboard improvements by identifying usability gaps, highlighting missing metrics, revealing data interpretation challenges, and uncovering workflow inefficiencies that impact decision-making processes. Through systematic feedback collection and analysis, organizations can enhance dashboard functionality, customize visualizations, and streamline data accessibility, ultimately delivering more intuitive interfaces and actionable insights for stakeholders.
-
Stunning collection! With a wide variety of options available, I was able to find a perfect slide for my presentation. Thank you, SlideTeam!
-
SlideTeam offers so many variations of designs and topics. It’s unbelievable! Easy to create such stunning presentations now.