

Dashboard To Track Several Projects Performance By Firm Corporate Strategy Overview Strategy SS





Try Before you Buy Download Free Sample Product
 Impress Your
Audience
 100%
Editable
 Save Hours
of Time


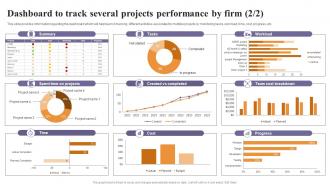
This slide provides information regarding the dashboard which will help team in tracking different activities associated to multiple projects by monitoring resources, tasks status, bugs and features closed, etc.
People who downloaded this PowerPoint presentation also viewed the following :
Dashboard To Track Several Projects Performance By Firm Corporate Strategy Overview Strategy SS with all 8 slides:
Use our Dashboard To Track Several Projects Performance By Firm Corporate Strategy Overview Strategy SS to effectively help you save your valuable time. They are readymade to fit into any presentation structure.






FAQs for Dashboard To Track Several Projects Performance By Firm Corporate Strategy
Focus on visual hierarchy first - put your most critical stuff top left where people naturally look. Only show KPIs that actually matter, seriously. I've worked with teams who throw everything on there and it's useless. Keep your colors and fonts consistent throughout. White space is your friend here, don't cram everything together. Navigation should be obvious - if someone has to think about how to use it, you've lost them. Make sure it loads quickly and works on phones too. Always add context like date ranges or benchmarks so the numbers mean something. Test with real users before you launch.
You know how staring at spreadsheets makes your eyes glaze over? That's exactly why data viz matters - our brains just eat up visuals way faster. Line charts show trends, bar graphs let you compare stuff, and suddenly those outliers jump right out at you. Here's the thing though - don't just dump everything into pie charts (seriously, people overuse those). Colors should highlight what actually matters, not look like a rainbow exploded. Oh, and figure out the top 3 things your users always ask about first. Then design your visuals to answer those right away.
Pick 5-7 metrics tops that actually matter to your main goals. More than that and people just tune out completely - trust me on this one. Each number should tell part of the bigger picture and help you make real decisions. Group similar stuff together so it's not all over the place. Always add context like timeframes or targets, otherwise nobody knows if 47% is amazing or terrible. Oh, and start with whatever your stakeholders bug you about most often. That's usually your most important metric right there, even if it seems obvious.
Test with real users constantly - that's honestly the only way to know if your dashboard actually works. Put your most critical metrics up front with labels that make sense to everyone. Don't cram everything into one screen though, I've watched teams build these "impressive" dashboards that are total disasters to navigate. Short sentences work. Keep colors consistent across the whole thing, and seriously ask yourself if a new person could figure it out in 30 seconds. Also make sure it doesn't take forever to load because people will just bounce. User testing sessions are gold - you'll catch stuff that would never occur to you otherwise.
Honestly, color makes or breaks dashboard design. Red screams "problem!" while green says everything's fine - blue just feels safe and neutral. But don't go crazy with bright colors everywhere or it becomes visual chaos. Also, tons of guys are colorblind (like 8% can't see red-green differences), so keep that in mind. I'd stick to maybe 3-4 colors max and use them the same way throughout. Oh, and definitely test it with real people first - what looks obvious to you might confuse the hell out of everyone else.
Honestly, it totally depends on how fast your data moves and when people actually need to make decisions. Real-time or hourly updates make sense for daily ops stuff. Weekly works fine for those big-picture monthly KPIs though. I've watched teams go crazy updating everything daily when their data literally only changes once a week - such a time suck! Match your refresh rate to how quickly your team needs to react. Ask yourself this: what's the shortest window where a data change would actually make someone do something different?
Tableau and Power BI are your best bets - super flexible with tons of templates. Healthcare or finance? Qlik Sense handles compliance better, which is honestly a huge pain point. Google Data Studio works fine too if you're not doing crazy complex stuff. Pick something that connects easily to whatever data sources you're already using. Nobody wants to spend weeks learning a new tool just to make charts. Oh, and definitely try free trials of like 2-3 options first. Build the same basic dashboard in each so you can actually compare them side by side.
Go mobile-first for sure. Make your buttons and filters way bigger - trust me, tiny tap targets are the worst on phones. Put your key metrics at the top so people don't have to scroll hunting for them. Vertical scrolling works better than cramming everything sideways. Those fancy charts that look amazing on your laptop? They're probably a mess on mobile, so simplify them. Oh and actually test on real phones, not just Chrome's device simulator - you'll catch stuff you'd totally miss otherwise. Less really is more when you've got like 4 inches to work with.
Start with the big picture stuff on your main dashboard, then let people dig deeper if they want. I like grouping similar data together - makes everything way cleaner. Use colors smartly but honestly, I've seen too many dashboards that look like a unicorn exploded. Interactive filters are clutch because everyone wants to see different things. Throw in some tooltips for the extra details. The whole point is making the important stuff jump out immediately while keeping the nerdy data just a click away. Oh, and visual hierarchy is huge - bold the stuff that actually matters.
Honestly, just figure out what your audience actually does with the data first. Executives want the big picture stuff they can make decisions on. Analysts? They need all the nitty-gritty details to dig into. I'd grab a few key users and just ask them about their day-to-day workflows - you'll be surprised what you learn. Then design it so the main metrics hit you right away, but people can click deeper if they want more. Oh and definitely test it with real people before you go live. Can't tell you how many times I've thought something was obvious and... it wasn't.
Start with your 3-5 most critical KPIs - the ones people actually need to make decisions. Don't cram everything onto one screen, it just creates chaos. Stick with consistent colors and chart types so users can focus on the data, not figuring out what they're looking at. Skip the vanity metrics that look cool but don't drive action. Mobile responsiveness is huge too - people check dashboards on their phones way more than you'd think. The goal is telling a clear story, not just throwing random data points at people and hoping something sticks.
Get regular surveys going and watch your usage analytics - that stuff's gold. Direct interviews work great too, plus in-app feedback buttons for quick wins. Honestly? Just sit behind someone using your dashboard sometime. You'll catch weird confusion you never saw coming. Track how long it takes people to find info and their click patterns alongside the survey responses. I always keep a feedback backlog and prioritize based on how often people complain about the same thing. Oh, and whether it actually helps them hit their goals. Start with one feedback method first - don't go crazy trying to do everything at once.
First thing - set up user roles so only the right people see sensitive stuff like financials or personal data. Don't hardcode credentials in dashboard URLs (I've made that mistake before, not fun). Short-term access? Set expiration dates. Screenshots are tempting but use your platform's built-in sharing instead - way more secure. Oh, and audit access regularly because people accumulate permissions like they're collecting Pokemon cards. Encrypted links are your friend here, trust me.
Dude, real-time data is a total game changer. Your dashboard goes from showing yesterday's stale numbers to what's actually happening right now. Problems? You'll catch them instantly instead of finding out hours later when it's too late. Same with opportunities - grab them before they disappear. Honestly, the speed difference is insane. Response times go from hours to literally minutes. But here's the thing - don't go crazy making everything live updates. Figure out what actually needs real-time tracking versus daily refreshes, because that live data gets pricey quick. Most stuff can wait.
Ugh, dashboard overload is the worst - your brain just shuts down when there's too much data staring at you. You'll either start picking numbers that back up what you already believe, or honestly? Just freeze completely. I've watched entire teams waste hours arguing about which metrics matter instead of doing anything productive. It's like analysis paralysis but worse because you feel busy looking at charts. Short sentences help sometimes. Keep it to maybe 3-5 key numbers and create separate views when you need to dig deeper. Trust me, less really is more here.
-
I joined SlideTeam last month and there’s no doubt that I tend to find our bond only strengthening over time. Best place to find world-class themes, templates, and icons.
-
I can say with full confidence that all your business, academic, or professional work requirements will be sufficed with SlideTeam. Their gallery is as rich as 2Million+!!