

Dashboard To Track Several Projects Performance By Firm Revamping Corporate Strategy





Try Before you Buy Download Free Sample Product
 Impress Your
Audience
 100%
Editable
 Save Hours
of Time


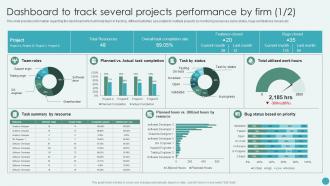
This slide provides information regarding the dashboard which will help team in tracking different activities associated to multiple projects by monitoring resources, tasks status, bugs and features closed, etc.
People who downloaded this PowerPoint presentation also viewed the following :
Dashboard To Track Several Projects Performance By Firm Revamping Corporate Strategy with all 7 slides:
Use our Dashboard To Track Several Projects Performance By Firm Revamping Corporate Strategy to effectively help you save your valuable time. They are readymade to fit into any presentation structure.






FAQs for Dashboard To Track Several Projects Performance By Firm
Essential KPIs for project performance dashboards include budget variance, schedule adherence, milestone completion rates, resource utilization, and quality metrics like defect rates. These indicators streamline project oversight by providing real-time visibility into financial health, timeline progress, and deliverable quality, enabling project managers to identify risks early and make data-driven adjustments that ultimately enhance project success rates.
Project performance dashboards can be customized through industry-specific KPIs, tailored visualizations, and sector-relevant metrics that align with unique operational requirements. Healthcare organizations might track patient outcomes and compliance rates, while manufacturing companies focus on production efficiency and quality control, with financial services emphasizing risk metrics and regulatory adherence, ultimately delivering targeted insights that enhance strategic decision-making.
Data visualization transforms complex project metrics into intuitive charts, graphs, heat maps, and progress indicators that enable instant comprehension of performance trends, bottlenecks, and milestones. Through visual representations, project managers can quickly identify resource allocation issues, timeline deviations, and budget variances, while stakeholders across organizations increasingly find that visual dashboards streamline decision-making and enhance project transparency.
Project performance dashboards should be updated daily for critical metrics like budget and timeline, with comprehensive reviews conducted weekly or bi-weekly depending on project complexity and stakeholder requirements. This strategic frequency enables project managers to identify potential issues early, make data-driven adjustments quickly, and maintain transparency across teams, ultimately delivering improved project outcomes and enhanced stakeholder confidence.
**INPUT**: What tools or software are best for creating a project performance dashboard? **OUTPUT**: Best tools for project performance dashboards include Microsoft Power BI, Tableau, Smartsheet, Monday.com, and Asana, each offering real-time tracking and customizable metrics. These platforms streamline project visibility by integrating multiple data sources, automating progress updates, and delivering actionable insights, with many organizations finding enhanced decision-making and improved team accountability. [Word count: 56 words]
A project performance dashboard helps identify potential risks early by monitoring key performance indicators, tracking milestone deviations, analyzing resource utilization patterns, and providing real-time visibility into project health metrics. Through automated alerts and trend analysis, project managers can detect budget overruns, schedule delays, and resource constraints before they escalate, ultimately enabling proactive risk mitigation and improved project success rates.
Common mistakes include overcrowding with excessive metrics, using unclear visualizations, neglecting stakeholder input, and failing to align with project objectives. These design flaws significantly reduce dashboard effectiveness by creating confusion, overwhelming users with irrelevant data, and ultimately delivering poor decision-making tools rather than the streamlined insights that enhance project management and drive successful outcomes.
Stakeholders benefit from project performance dashboards through real-time visibility into project progress, budget utilization, resource allocation, timeline adherence, and risk indicators. These comprehensive dashboards enable executives, project managers, and team members to make data-driven decisions faster, identify potential issues earlier, and maintain alignment across departments, ultimately delivering improved project outcomes and enhanced organizational transparency.
**INPUT**: What data sources should be integrated into a project performance dashboard for comprehensive insights? **OUTPUT**: Project performance dashboards should integrate project management tools, financial systems, resource allocation platforms, time tracking software, and quality management databases. These integrated sources streamline decision-making by delivering real-time budget visibility, resource optimization insights, and milestone tracking capabilities, with many organizations finding that comprehensive data integration ultimately enhances project delivery speed and reduces operational costs. **Word count: 54 words**
User feedback improves dashboard design by identifying pain points, highlighting missing metrics, revealing workflow inefficiencies, and uncovering user interface challenges that hinder adoption. Through surveys, interviews, and usage analytics, project managers can streamline navigation, enhance data visualization clarity, and add relevant KPIs, ultimately delivering dashboards that align with actual user needs and improve decision-making efficiency.
Project success metrics include budget adherence, quality standards achievement, stakeholder satisfaction scores, resource utilization efficiency, and business value realization. These comprehensive measures enable project managers to assess performance holistically, with many organizations finding that combining financial, operational, and strategic indicators delivers deeper insights into project effectiveness and long-term competitive advantage.
A project performance dashboard facilitates communication by providing centralized visibility into project metrics, progress updates, milestone tracking, and resource allocation in real-time. Through shared access to consistent data, team members can identify bottlenecks, coordinate responses, and align priorities more effectively, while stakeholders receive transparent updates, ultimately reducing miscommunication and enhancing collaborative decision-making across all project phases.
Static project performance dashboards display fixed data snapshots requiring manual updates, while interactive dashboards enable real-time filtering, drilling down into metrics, and dynamic data manipulation. Interactive versions allow project managers to explore specific time periods, team performance, and budget variances in real-time, ultimately delivering faster decision-making and enhanced project oversight capabilities.
Project performance dashboards enhance resource allocation by providing real-time visibility into team utilization, budget consumption, task progress, and bottleneck identification across multiple projects simultaneously. Through centralized data visualization, project managers can quickly redistribute personnel, reallocate budgets, and prioritize critical tasks, while organizations streamline decision-making processes, minimize resource conflicts, and ultimately deliver improved project outcomes and operational efficiency.
Best practices for presenting project data include using clear visual hierarchies, selecting relevant KPIs, implementing consistent color coding, ensuring real-time data updates, and maintaining intuitive navigation structures. These approaches streamline decision-making by reducing information overload, enhancing data accessibility, and enabling quick performance assessments, with many project managers finding that well-designed dashboards ultimately deliver faster issue resolution and improved stakeholder communication across their organizations.
-
Loved the templates on SlideTeam, I believe I have found the go to place for my presentation needs!
-
Extremely professional slides with attractive designs. I especially appreciate how easily they can be modified and come in different colors, shapes, and sizes!