

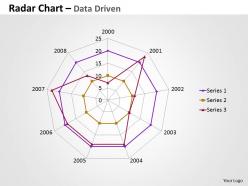
Data driven chart comparing multiple entities powerpoint slides





Try Before you Buy Download Free Sample Product
 Impress Your
Audience
 100%
Editable
 Save Hours
of Time


Choose our data driven chart comparing multiple entities PowerPoint template and attract the attention of your team. Charts are used for creating visual explanation of data and presenting business information in a simple and easy way. When preparing business reports or business presentations, the first step is deciding on the format of the charts you are going to use. Our data driven comparing multiple entities PowerPoint slide is commonly used to represent data that shows changes over time, which helps people visualize trends. Our data driven Presentation visual slide is easy to understand and fully modifiable. The graphics are also beneficial for analyzing your business data and drawing out conclusions for future. So, make sure you use our overwhelming data driven chart comparing multiple entities PPT design and track your business performance in future. Enjoy some leeway with our Data Driven Chart Comparing Multiple Entities Powerpoint Slides. Give your thoughts a lot more room.
People who downloaded this PowerPoint presentation also viewed the following :
Data driven chart comparing multiple entities powerpoint slides with all 3 slides:
You will never know creating animated slides was so easy until you use our Data Driven Chart Comparing Multiple Entities Powerpoint Slides. All the hard work has already been done for you.


-
Excellent products for quick understanding.
-
Great experience, I would definitely use your services further.