

Data preparation process overview effective data preparation to make data accessible




Try Before you Buy Download Free Sample Product
 Impress Your
 Audience
 100%
100% Editable
 Save Hours
 of Time


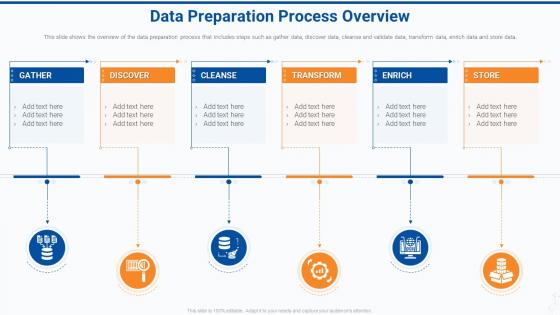
This slide shows the overview of the data preparation process that includes steps such as gather data, discover data, cleanse and validate data, transform data, enrich data and store data.
People who downloaded this PowerPoint presentation also viewed the following :
Data preparation process overview effective data preparation to make data accessible with all 6 slides:
Use our Data Preparation Process Overview Effective Data Preparation To Make Data Accessible to effectively help you save your valuable time. They are readymade to fit into any presentation structure.





FAQs for Data preparation process overview effective data preparation to
Okay so first thing - profile your data so you know what you're working with. Missing values are gonna be your biggest headache, so decide whether to fill them or just drop those rows. Duplicates are usually easy to spot and remove. Outliers though? That's where it gets tricky - some are legit, others are just bad data. Also watch out for formatting inconsistencies - like dates written different ways or categories spelled wrong. Honestly the worst is when you think you're done cleaning and then realize half your "Male/Female" column says "M/F" instead. Validation helps catch the obvious errors. Just be systematic about it rather than bouncing around randomly.
So first thing - use `.isnull()` or `.info()` to find where data's missing. Then you've got a few ways to handle it. Drop rows if it's just a tiny percentage missing. Fill numerical gaps with mean or median. Time series? Forward fill works well. Honestly though, don't rush to delete everything right away - I learned this the hard way once. Missing data patterns can actually reveal stuff about what went wrong during collection. My advice? Visualize the missing data first, see what you're working with, then pick your approach based on what makes sense for your specific situation.
Honestly, Excel's still your best friend for basic stuff and smaller datasets - don't sleep on it. Python with pandas is amazing if anyone on your team codes, plus it's free. Tableau Prep and Power BI work great for non-technical people who need something more robust. Alteryx costs a fortune but man, those drag-and-drop workflows are sweet for complex jobs. I'd say just start with whatever your team already knows how to use. Then you can always upgrade later when your data gets messier or bigger. No point overcomplicating things from the jump.
Oh dude, you HAVE to normalize your data or you'll hate yourself later. Picture this: you've got age (like 25, 30, 40) and then income ($50,000, $80,000) - your algorithm gets totally distracted by those big salary numbers and basically ignores age. Neural networks are especially dramatic about this stuff. Just scale everything to 0-1 or standardize it so the mean's zero. Your model will actually learn patterns instead of just... being weird about large numbers. Plus gradient descent won't take forever to converge. Trust me on this one.
So data transformation is basically reshaping your data - like fixing date formats or normalizing values. Integration is when you're stuck combining datasets from different sources, which honestly sucks when they don't match up. Reduction just means cutting down your dataset size by ditching redundant stuff or sampling without losing the important bits. I usually think of it like: reshape, merge, then trim. Most of the time you'll end up doing all three anyway. Figure out what's actually broken first though - saves you from going down random rabbit holes that waste hours.
So feature engineering is basically taking your messy raw data and turning it into something useful for your models. Like converting timestamps into "day of week" or creating ratios between different metrics. Most of the real work happens here, honestly. You'll normalize values, deal with missing data, encode categories so algorithms can actually read them. I always start by figuring out what each feature means, then think about what combinations might reveal something interesting. It's about making the data tell a better story - way more important than people realize.
Ugh, the worst mistake is rushing through cleaning without actually looking at your data first. Profile it to see what you're dealing with! Duplicates and missing values will wreck everything downstream. Also watch for wonky formatting - like dates in three different formats because Karen from accounting had her own system. Outliers might be typos, not real extremes. Oh and seriously, write down what you did. I can't tell you how many times I've stared at cleaned data months later going "what the hell did past me do here?" Start slow, document as you go.
Oh dude, document everything from the start - your original dataset structure, every cleaning step, what you removed. I made this mistake once and totally corrupted my data with zero way to fix it, nightmare fuel honestly. Hash values are your friend for checking if files got messed up during transfers. Never touch the original files, work on copies always. Write scripts instead of doing manual edits because you'll need to recreate your process later and trust me, you won't remember what you did. Also keep logs of literally every change you make.
Look, data prep is where privacy compliance actually happens - not some afterthought checkbox exercise. You'll be identifying sensitive info, setting up anonymization techniques, and building proper access controls from the start. GDPR and CCPA requirements? Handle them during prep by implementing data minimization and making sure you can easily delete stuff when customers ask. Building privacy protections later is honestly a complete mess - learned that one the hard way. Oh, and document your data lineage while you're at it. Trust me, when auditors show up wanting to trace how personal data moves through your systems, you'll be glad you did the work upfront.
Dude, visualizations will save your butt when prepping data. I swear I catch way more issues with quick plots than staring at spreadsheets for hours. Histograms show you weird gaps or skewed distributions right away. Scatter plots? They'll reveal correlations you never expected. Box plots are clutch for finding outliers hiding in your data. Honestly, I probably waste too much time on this step, but it's worth it – I'll spend like 30% of my prep just making basic plots to double-check everything looks normal. Start simple with histograms and scatter plots for each variable. You'll catch most problems immediately.
Honestly, just start with some quick plots - box plots and scatter plots will show you the weird stuff right away. Way easier than diving into formulas first. For the math side, Z-scores work great (flag anything past 2-3 standard deviations) or try the IQR method where you catch outliers beyond 1.5*IQR from your quartiles. Once you spot them, you've got choices. Remove them completely, cap them at sensible limits (that's called winsorizing btw), or do a log transform to minimize their punch. Really depends if they're actual errors or just extreme values that make sense for your data.
Honestly, domain knowledge is like having insider info when you're cleaning data. You can't just run generic preprocessing and hope for the best - that's how you accidentally delete the exact patterns you need. I learned this the hard way when I removed "outliers" that were actually critical signals. Subject experts catch weird data issues that automated tools totally miss. They'll tell you which features matter and what transformations make sense for your specific problem. Trust me, loop them in from day one or you'll be redoing everything later.
Ugh, learned this one the hard way when I had to rebuild a dataset months later and had zero clue what past-me was thinking. Document everything - your cleaning steps, where the data came from, why you filtered certain stuff out. Comment your code like you're explaining it to someone else. Git commits are your friend here, use actual descriptions not just "updated preprocessing." Also keep a simple README explaining your pipeline flow. Honestly the worst feeling is staring at your own code six months later going "what does this even do??" Your teammates will love you for it too.
Dude, you'll save like 70-80% of your time with automated data prep tools - no joke. Manual cleaning is where all those annoying human errors happen anyway. These tools knock out the boring stuff super fast: finding outliers, fixing formats, dealing with missing data. Consistency is huge too since you won't accidentally use different rules on different batches (been there, it sucks). They catch stuff you'd totally miss when you're running on fumes at 2pm. The built-in validation is honestly pretty solid. Oh, and definitely pick something that plays nice with whatever you're already using.
Check your completeness rate first - basically how much data's missing. Accuracy comes next through validation rules or just spot-checking samples. Consistency's huge too - look for duplicates and conflicting entries that don't match up. Honestly, distribution checks are underrated. They'll catch weird outliers that could totally screw things up later. If you've got timestamps, measure how fresh your data is. Also track uniqueness rates for your key identifiers. Those core metrics will catch most problems before they snowball into bigger headaches.
-
I discovered this website through a google search, the services matched my needs perfectly and the pricing was very reasonable. I was thrilled with the product and the customer service. I will definitely use their slides again for my presentations and recommend them to other colleagues.
-
Helpful product design for delivering presentation.