


Defining Business Performance Management Objectives to Achieve Key Results OKR complete deck




Try Before you Buy Download Free Sample Product
 Impress Your
 Audience
 100%
100% Editable
 Save Hours
 of Time


Objectives and key results also known as OKR is a goal-setting methodology to define, streamline and implement actions to achieve desired results. The Defining business performance management objectives to achieve critical results OKR PowerPoint presentation concentrates mainly on quarterly or monthly targets for business performance improvement. Moreover, the Business performance improvement deck mainly covers the challenges and issues organizations face due to poor business performance management. Also, the Corporate performance management PPT focuses on critical statistics highlighting the need for goal setting for performance optimization. Furthermore, the Strategic business goals presentation will assist the company in reviewing its existing performance and implementing various strategies to optimize the net profit margin. Additionally, the BPM goals template includes tactics such as investing in sales tools, healthy feedback culture, content, social media, email marketing strategies, minimizing costs, etc. Lastly, Enterprise performance management Powerpoint also provides insights into dashboards and KPIs such as annual sales revenue, gross profit margin, net profit margin, customer acquisition cost, campaign results, cash flow statements, etc. Get access to this 100 percent editable template now.
People who downloaded this PowerPoint presentation also viewed the following :
Content of this Powerpoint Presentation
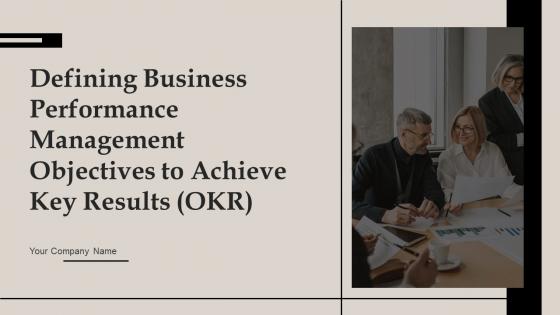
Slide 1: The slide introduces Defining Business Performance Management Objectives to Achieve Key Results (OKR).
Slide 2: This is an Agenda slide. State your agendas here.
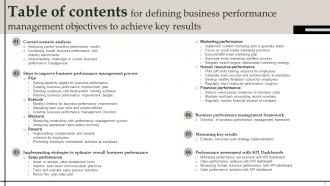
Slide 3: The slide depicts table of contents for presentation.
Slide 4: The slide continues table of contents.
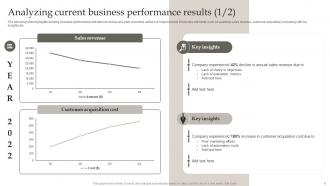
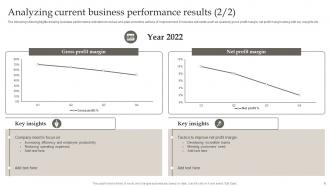
Slide 5: The slide highlights existing business performance indicators to review and plan corrective actions of improvement.
Slide 6: The slide existing business performance indicators to review and plan corrective actions of improvement.
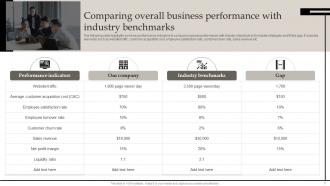
Slide 7: The slide illustrates some key performance indicators to compare business performance with industry standards.
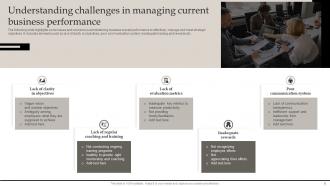
Slide 8: The slide highlights some issues and concerns in administering business overall performance.
Slide 9: The slide displays another title of contents.
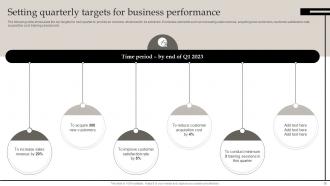
Slide 10: The slide showcases the key targets for next quarter to provide an overview what need to be achieved.
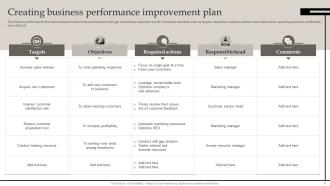
Slide 11: The slide depicts the business performance improvement plan to fill gap and achieve expected results.
Slide 12: The slide depicts the training calendar to schedule programs and manage resources accordingly.
Slide 13: The slide depicts the first quarterly budget to plan business expenses and manage resources accordingly.
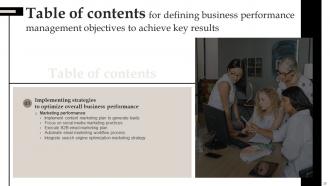
Slide 14: The slide highlights another title of contents.
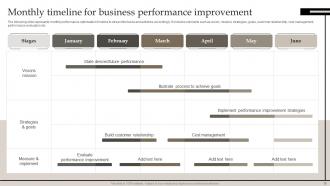
Slide 15: The slide represents monthly performance optimization timeline to streamline tasks and activities accordingly.
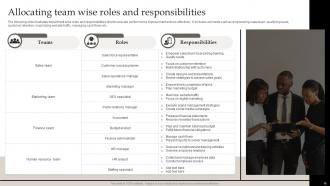
Slide 16: The slide illustrates department wise roles and responsibilities chart.
Slide 17: The slide depicts performance management checklist to ensure timely execution of tasks.
Slide 18: The slide renders title of contents further.
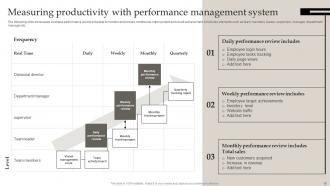
Slide 19: The slide showcases business performance review schedule to monitor and ensure continuous improvement and result achievement.
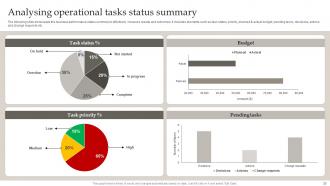
Slide 20: The slide showcases the business performance status summary to effectively measure results and outcomes.
Slide 21: The slide displays another title of contents.
Slide 22: The slide showcases some reward schemes to support alignment of organizational goals with employees.
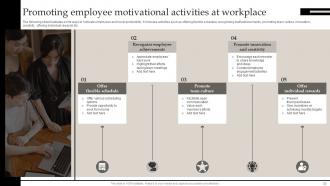
Slide 23: The following slide illustrates some ways to motivate employees and boost productivity.
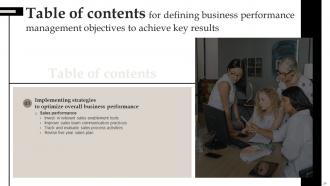
Slide 24: The slide highlights title of contents which is to be discussed further.
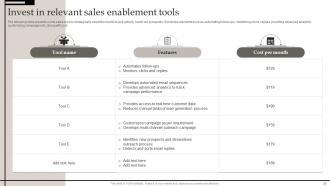
Slide 25: The slide presents some sales tools to strategically select the best tool and actively reach out prospects.
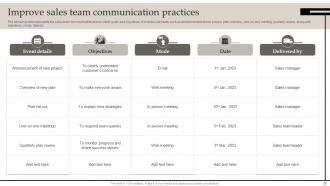
Slide 26: The slide represents the sales team communication plan to clarify goals and objectives.
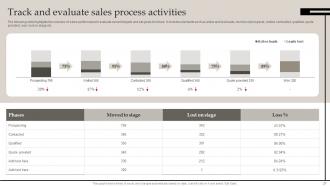
Slide 27: The slide highlights the overview of sales performance to evaluate current targets and set goals for future.
Slide 28: The following slide represents new sales five year plan to set benchmarks and adjust actions to achieve desired goals.
Slide 29: The slide depicts another title of contents.
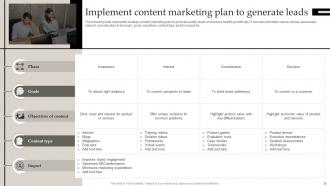
Slide 30: The slide represents strategic content marketing plan to generate quality leads and ensure healthy growth rate.
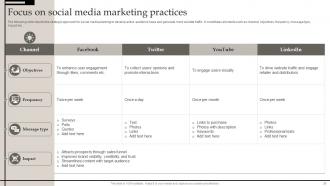
Slide 31: The slide depicts the strategic approach for social media planning to develop active audience base and generate more website traffic.
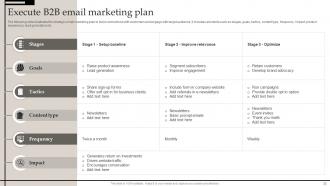
Slide 32: The slide illustrates the strategic email marketing plan to build connections with customers and engage with target audience.
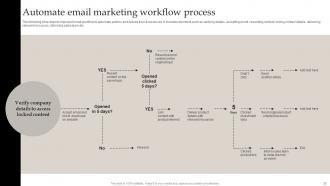
Slide 33: The slide depicts improved email workflow to automate actions and reduce time & resources.
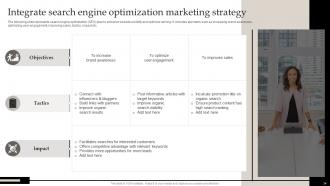
Slide 34: The slide represents search engine optimization (SEO) plan to enhance website visibility and optimize ranking.
Slide 35: The slide displays title of contents further.
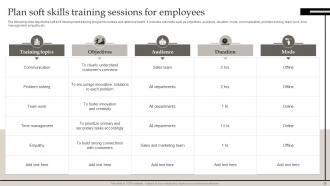
Slide 36: The slide depicts the soft skill development training program to nurture and retain top talent.
Slide 37: The slide depicts some ideas to praise team success and boost employee confidence.
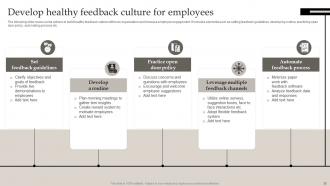
Slide 38: The following slide covers some actions to build healthy feedback culture within an organization.
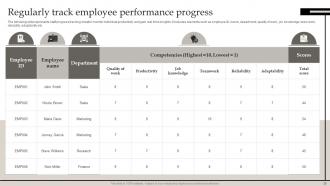
Slide 39: The slide represents staff progress tracking sheet to monitor individual productivity and gain real time insights.
Slide 40: The slide renders title of contents further.
Slide 41: The following slide highlights some expenses that need to be cut down to minimize operating costs and gain business efficiency.
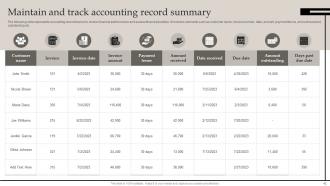
Slide 42: The slide represents accounting record tracker to review financial performance and assess financial position.
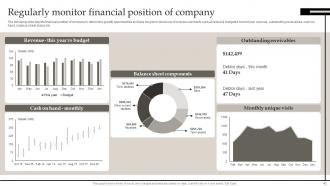
Slide 43: The slide depicts financial position of company to determine growth opportunities and take long term decisions.
Slide 44: The slide also contains title of contents further.
Slide 45: The following slide represents framework for business performance to ensure proper utilization of resources and goal achievements.
Slide 46: The slide shows another title of contents.
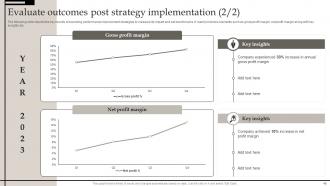
Slide 47: The following slide depicts the key results of executing performance improvement strategies to measure its impact and set benchmarks.
Slide 48: The slide continues the key results of executing performance improvement strategies to measure its impact and set benchmarks.
Slide 49: The slide displays another title of contents.
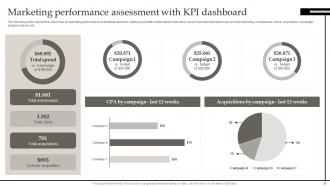
Slide 50: The following slide depicts the outcomes of marketing performance to facilitate decision making and better understand customers’ need.
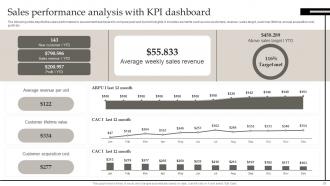
Slide 51: The slide depicts the sales performance to assessment dashboard to compare past and current insights.
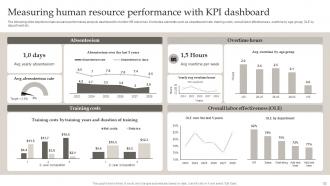
Slide 52: The slide depicts human resource performance analysis dashboard to monitor HR outcomes.
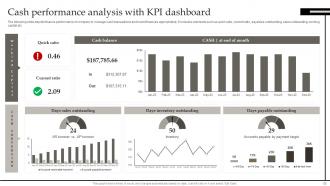
Slide 53: The following slide depicts finance performance of company to manage cash transactions and invest finances appropriately.
Slide 54: This slide shows all the icons included in the presentation.
Slide 55: This slide is titled as Additional Slides for moving forward.
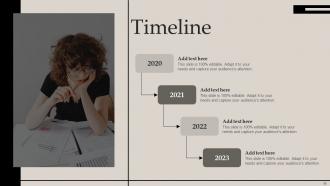
Slide 56: This is a Timeline slide. Show data related to time intervals here.
Slide 57: This is Our Team slide with names and designation.
Slide 58: This slide shows Post It Notes. Post your important notes here.
Slide 59: This slide shows Pie Chart with data in percentage.
Slide 60: This slide depicts Venn diagram with text boxes.
Slide 61: This is Our Target slide. State your targets here.
Slide 62: This is a Thank You slide with address, contact numbers and email address.
Defining Business Performance Management Objectives to Achieve Key Results OKR complete deck with all 67 slides:
Use our Defining Business Performance Management Objectives to Achieve Key Results OKR complete deck to effectively help you save your valuable time. They are readymade to fit into any presentation structure.

























FAQs for Defining Business Performance Management Objectives to Achieve Key Results
Effective Business Performance Management comprises strategic goal setting, performance measurement frameworks, data analytics and reporting systems, continuous monitoring processes, and feedback mechanisms for course correction. These components work synergistically to align organizational activities with business objectives, enabling companies across industries like manufacturing and financial services to optimize resource allocation, enhance operational efficiency, and ultimately deliver measurable competitive advantage through data-driven decision making.
The OKR framework enhances BPM processes by providing clear goal alignment, measurable outcomes, and regular performance tracking cycles that streamline strategic execution. Through quarterly objective setting and data-driven key results, organizations can accelerate decision-making, improve resource allocation, and maintain operational transparency, with many companies finding that this combination delivers faster strategic pivots and enhanced competitive advantage in increasingly dynamic markets.
Organizations should establish clear objective-setting guidelines, ensure alignment between individual and company goals, implement regular check-ins rather than annual reviews, and foster transparency across all levels. These practices enhance accountability and focus by creating measurable outcomes, enabling real-time course corrections, and promoting cross-functional collaboration, with many companies finding that quarterly cycles and visible progress tracking ultimately deliver improved performance and stronger strategic execution.
OKRs align with business objectives by cascading strategic goals from company-level to team-level, ensuring every employee's work directly contributes to organizational priorities through measurable key results. This strategic alignment enables leaders to track performance metrics across departments, identify resource allocation opportunities, and maintain operational focus, with many organizations finding that OKRs deliver enhanced transparency and accelerated goal achievement.
Data analytics serves as the backbone for measuring OKR success within BPM by providing real-time performance tracking, predictive insights, trend analysis, and automated reporting capabilities. Through advanced analytics platforms, organizations can monitor key result progress, identify performance gaps, and make data-driven adjustments to strategic objectives, ultimately enabling more agile decision-making and enhanced organizational alignment.
Organizations ensure ambitious yet achievable OKRs by setting stretch goals with 70-80% confidence levels, conducting quarterly calibration sessions, and establishing clear measurement frameworks that balance aspiration with realistic resource constraints. Through iterative goal-setting processes, companies like Google and Intel regularly adjust targets based on performance data and market conditions, ultimately delivering sustained growth while maintaining team motivation and organizational momentum.
Common pitfalls include setting too many objectives, creating vague measurables, cascading poorly across departments, focusing solely on lagging indicators, and treating OKRs as static annual goals. Organizations can avoid these by limiting objectives to 3-5 per quarter, defining specific numerical targets, ensuring cross-functional alignment, balancing leading and lagging metrics, and conducting regular check-ins to adjust priorities based on business needs.
Cross-departmental collaboration enhances BPM outcomes with OKRs by aligning objectives across teams, eliminating silos, and creating shared accountability for organizational goals. This strategic integration enables departments like sales, marketing, and operations to coordinate efforts more effectively, streamline resource allocation, and accelerate decision-making, ultimately delivering improved performance visibility and faster achievement of key business results.
OKR tracking techniques include regular check-ins, progress dashboards, quarterly reviews, milestone tracking, and automated performance analytics. These methods enhance accountability by providing real-time visibility into goal progression, enabling data-driven adjustments, and facilitating transparent communication across teams, with many organizations finding that consistent measurement cycles ultimately deliver improved strategic alignment and accelerated business outcomes.
Organizations should review OKRs quarterly for comprehensive assessment and monthly for progress tracking, with annual strategic alignment reviews to ensure objectives remain relevant to evolving business priorities. Many companies find that this cadence enables agile adaptation to market changes while maintaining strategic focus, ultimately delivering improved performance visibility and faster goal achievement across departments.
Effective OKR management tools include Asana, Monday.com, Weekdone, Lattice, and 15Five, which integrate goal tracking with performance analytics. These platforms streamline objective alignment, automate progress reporting, and enhance transparency across teams, with many organizations finding that dedicated OKR software delivers faster goal achievement and improved strategic execution.
Employee engagement integrates into OKRs through regular check-ins, collaborative goal-setting sessions, transparent progress tracking, and structured feedback loops that connect individual contributions to broader business performance objectives. Organizations like Microsoft and Adobe leverage quarterly OKR reviews combined with continuous feedback platforms, enabling employees to adjust objectives dynamically while maintaining alignment, ultimately delivering higher engagement scores and improved business outcomes.
OKRs drive accountability by establishing clear, measurable objectives with transparent tracking, regular check-ins, and visible progress updates across all team levels. This framework enhances business performance through improved alignment, faster decision-making, and strategic focus, with many organizations finding that quarterly OKR cycles ultimately deliver increased productivity, better resource allocation, and stronger competitive positioning.
Company culture significantly impacts OKR implementation in BPM through transparency levels, collaboration habits, accountability practices, and leadership commitment to goal-setting frameworks. Organizations with open communication, cross-functional teamwork, and performance-oriented cultures find that OKRs integrate seamlessly, while traditional hierarchical environments may require cultural shifts to achieve meaningful alignment and measurable business outcomes.
Organizations balance short-term KPIs with long-term objectives by implementing OKRs across multiple time horizons, creating quarterly objectives that ladder up to annual strategic goals while maintaining weekly KPI tracking. This approach enables companies to monitor immediate operational metrics like sales targets and customer satisfaction scores, while simultaneously driving progress toward transformational objectives such as market expansion or digital innovation, ultimately delivering both operational efficiency and strategic competitive advantage.
-
Exclusive and extensive collection of templates. Really helped me create a professional presentation in just no time.
-
“I really like the convenient operation and professionalism I saw on the SlideTeam website. I want to express my regards and appreciation to the team.”