

Deploying QMS KPI Dashboard To Track Performance Of Quality Management System Strategy SS V




Try Before you Buy Download Free Sample Product
 Impress Your
 Audience
 100%
100% Editable
 Save Hours
 of Time


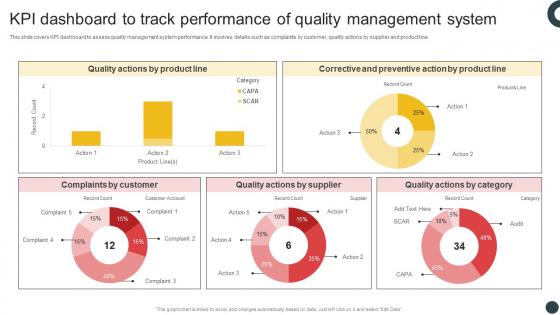
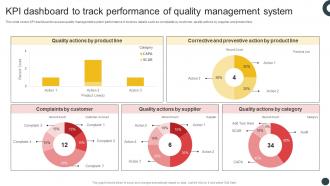
This slide covers KPI dashboard to assess quality management system performance. It involves details such as complaints by customer, quality actions by supplier and product line.
People who downloaded this PowerPoint presentation also viewed the following :
Deploying QMS KPI Dashboard To Track Performance Of Quality Management System Strategy SS V with all 10 slides:
Use our Deploying QMS KPI Dashboard To Track Performance Of Quality Management System Strategy SS V to effectively help you save your valuable time. They are readymade to fit into any presentation structure.








FAQs for Deploying QMS KPI Dashboard To Track Performance Of Quality Management System
Essential QMS KPI dashboard indicators include defect rates, customer satisfaction scores, audit compliance percentages, corrective action turnaround times, process cycle efficiency metrics, and cost of quality measurements. These performance indicators streamline quality management by enabling real-time monitoring, predictive issue identification, and data-driven decision making, with many manufacturing and service organizations finding that integrated dashboards ultimately deliver enhanced operational efficiency and sustained competitive advantage.
Organizations tailor their QMS KPI dashboards by selecting industry-specific metrics, customizing compliance frameworks, and integrating sector-relevant data sources like regulatory requirements and customer standards. Through configurable templates and automated reporting, companies in healthcare, manufacturing, and financial services can track unique quality indicators, streamline audit processes, and enhance operational efficiency while maintaining regulatory compliance.
Data visualization transforms complex QMS metrics into intuitive charts, graphs, and heat maps that enable instant pattern recognition, trend identification, and anomaly detection across quality processes. Through visual dashboards, quality managers can quickly assess compliance status, track corrective action progress, and identify bottlenecks in real-time, ultimately accelerating decision-making and enhancing organizational quality performance.
Organizations should update their QMS KPI dashboards daily or weekly for operational metrics, while strategic quality indicators can be refreshed monthly or quarterly depending on data collection cycles. Many manufacturing and healthcare organizations find that automated real-time updates for critical metrics like defect rates and compliance scores, combined with scheduled updates for trend analysis, ultimately delivers enhanced decision-making speed and improved quality outcomes.
Common pitfalls include overloading dashboards with excessive metrics, choosing vanity metrics over actionable KPIs, poor data visualization that obscures insights, lack of real-time data integration, and insufficient user training. Organizations often struggle with unclear objectives, inconsistent data sources, and failing to align metrics with quality standards, ultimately creating dashboards that overwhelm users rather than streamline decision-making and enhance operational efficiency.
A QMS KPI dashboard drives continuous improvement by providing real-time visibility into quality metrics, identifying performance trends, highlighting process bottlenecks, and enabling data-driven decision making. Through automated tracking and visual analytics, organizations streamline corrective actions, reduce defect rates, and enhance compliance monitoring, with manufacturing and healthcare sectors finding that transparent quality metrics ultimately deliver faster issue resolution and sustained operational excellence.
**INPUT**: What metrics should be prioritized for regulatory compliance in a QMS KPI dashboard? **OUTPUT**: Regulatory compliance metrics should prioritize audit findings, corrective action completion rates, document control effectiveness, training compliance percentages, and non-conformance trends. These indicators streamline compliance monitoring by tracking regulatory adherence, minimizing audit risks, and ensuring systematic quality management, with many organizations finding that real-time visibility ultimately delivers faster regulatory responses and sustained compliance performance. **Word count: 54 words**
Organizations ensure stakeholder alignment through QMS KPI dashboards by establishing standardized metrics, creating role-specific views, and implementing regular review cycles that connect operational performance to strategic objectives. These dashboards enable transparent communication across departments, facilitate data-driven decision making, and provide real-time visibility into quality outcomes, with many companies finding that shared KPI visibility ultimately enhances accountability and drives collaborative improvement initiatives.
**INPUT**: What technology tools are most effective for creating a QMS KPI dashboard? **OUTPUT**: Effective QMS KPI dashboard tools include Microsoft Power BI, Tableau, QlikView, SAP Analytics Cloud, and Sisense for comprehensive data visualization. These platforms streamline quality management by integrating multiple data sources, automating compliance reporting, and delivering real-time performance insights, with manufacturing and healthcare organizations finding that enhanced visibility ultimately drives operational efficiency and regulatory adherence. [Word count: 58 words]
Feedback loops enhance QMS KPI dashboard reporting by enabling real-time data validation, automated corrective action triggers, and continuous performance refinement based on actual outcomes. Through integrated feedback mechanisms, organizations streamline quality monitoring, accelerate response times to deviations, and maintain dynamic dashboards that adapt to changing quality standards, ultimately delivering more accurate reporting and proactive quality management across manufacturing and service sectors.
Trend analysis in QMS KPI dashboards reveals performance patterns over time, identifying improvement opportunities, process degradation, and compliance risks before they escalate into major issues. By tracking metrics like defect rates, customer satisfaction scores, and audit findings across months or quarters, organizations can make proactive decisions, optimize resource allocation, and demonstrate continuous improvement to stakeholders, ultimately delivering enhanced quality outcomes.
Customer satisfaction measurement through QMS KPI dashboards involves tracking Net Promoter Scores, complaint resolution times, customer retention rates, product defect rates, and service delivery metrics in real-time. These integrated dashboards enable organizations to identify satisfaction trends, correlate quality issues with customer feedback, and implement corrective actions swiftly, with many service-oriented businesses finding that automated satisfaction tracking delivers enhanced customer experiences and competitive advantage.
A QMS KPI dashboard facilitates better decision-making by providing real-time visibility into quality metrics, standardizing performance measurements across departments, and identifying trends before issues escalate. Through centralized data visualization, organizations streamline compliance monitoring, enhance resource allocation, and accelerate corrective actions, with many manufacturing and healthcare companies finding that dashboard-driven insights ultimately deliver faster response times and improved operational efficiency.
Training and support significantly impact QMS KPI dashboard adoption by ensuring user competency, reducing resistance to change, and maximizing system utilization across all organizational levels. Through comprehensive onboarding programs, ongoing technical assistance, and role-specific guidance, organizations streamline implementation timelines, enhance data accuracy, and ultimately deliver improved quality outcomes, with many finding that well-trained teams achieve faster ROI.
Best practices for sharing QMS KPI dashboard insights include establishing standardized reporting schedules, creating role-specific dashboard views, implementing automated alert systems, conducting regular cross-departmental review meetings, and developing clear escalation protocols for critical metrics. These approaches enhance organizational alignment by ensuring relevant stakeholders receive timely, actionable data while maintaining transparency across operations, with many organizations finding that structured communication ultimately delivers improved compliance outcomes and faster issue resolution.
-
Well-designed and informative templates. Absolutely brilliant!
-
Excellent work done on template design and graphics.