


Devops KPI Metrics Dashboard With Total Builds




Try Before you Buy Download Free Sample Product
 Impress Your
 Audience
 100%
100% Editable
 Save Hours
 of Time


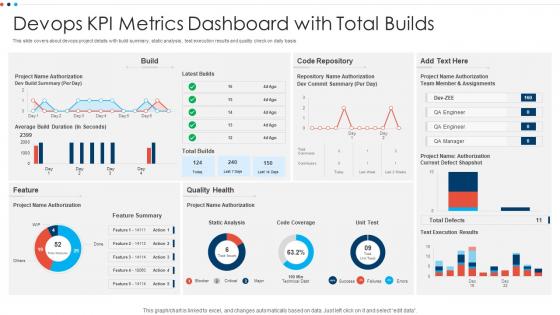
This slide covers about devops project details with build summary, static analysis , test execution results and quality check on daily basis.
People who downloaded this PowerPoint presentation also viewed the following :
Devops KPI Metrics Dashboard With Total Builds with all 7 slides:
Use our Devops KPI Metrics Dashboard With Total Builds to effectively help you save your valuable time. They are readymade to fit into any presentation structure.





FAQs for Devops KPI Metrics Dashboard
So the DORA metrics are where you want to start - deployment frequency, lead time, MTTR, and change failure rate. Deployment frequency is basically how often you're pushing code live. Lead time tracks how long stuff takes from commit to production. MTTR shows how fast you recover from outages (which will happen, trust me). Change failure rate tells you if your code is actually stable. There's like a million other metrics you could obsess over, but honestly? These four will give you everything you need to know about how your team's doing. Get good at measuring these first, then worry about the fancy stuff later.
Honestly, the best thing about KPI dashboards is getting everyone on the same page - no more guessing what's actually happening. Your dev and ops teams can finally see deployment frequency, lead times, failure rates, all that stuff in real-time. Makes it so much easier to catch problems early instead of playing the blame game later (we've all been there). When everyone's looking at the same numbers, people naturally start working together toward fixes rather than against each other. Oh, and definitely set up alerts so you're not constantly checking manually - your sanity will thank you.
Grafana, Datadog, and New Relic are your best bets here. If you want total control and don't mind tinkering, go with Grafana. Datadog costs more but honestly saves you so much setup headache - totally worth it if money's not an issue. New Relic kills it for app performance monitoring specifically. Here's the thing though - I've watched entire teams spend forever arguing over which tool to use instead of just picking one and getting started. Just grab whatever plays nice with your existing monitoring stuff and go from there. You can always switch later if it sucks.
Honestly, less is more here. Stick to like 5-7 metrics tops - I learned this the hard way when I built these elaborate dashboards nobody touched. Match them to what your team actually cares about right now. Reliability issues? Track MTTR and how often you're deploying. Speed problems? Lead time's your friend. Here's the test though - if a metric turns red and nobody does anything about it, just dump it. Oh, and don't get married to your metrics. Switch them up every few months as priorities change.
You absolutely need automation for DevOps metrics - manual collection is a total pain and you'll mess up the data constantly. Set up automated pulls from your CI/CD tools and monitoring systems right away. Real-time metrics beat taking random snapshots any day. Plus you won't have human error skewing your deployment frequency or lead times. I learned this the hard way trying to track stuff manually at my last job - what a disaster. Get those tool integrations and dashboards automated from the start. Consistent data collection happens automatically then, and you can actually spot trends instead of guessing.
Load time and performance metrics are basically the heart of your DevOps feedback loop. Slow response times or high error rates on your dashboard? That's telling you exactly where to focus your deployment efforts. You'll catch performance issues before users even notice - trust me, this saves so much drama later. Plus they help with capacity planning and deciding when to scale up. Oh, and set up alerts so you're not just hoarding data. Your team should be looking at these during standups and retros too.
Don't try tracking everything at once - you'll end up with a crazy dashboard nobody looks at. Stick to maybe 5-7 metrics that actually matter for your team's goals. Skip the vanity stuff like lines of code (waste of time honestly). Track deployment frequency or mean time to recovery instead. Oh, and figure out your audience first. Too technical for stakeholders? They zone out. Too high-level for engineers? They'll ignore it completely. I'd say start simple with what people will actually use, then build from there based on what gets attention.
For the critical stuff like deployment frequency and failure rates, you'll want real-time updates so you catch problems fast. Daily standups are perfect for quick checks, then dig deeper weekly with your team. Monthly reviews work well for the bigger picture conversations with stakeholders. Honestly though, don't obsess over every metric - lead time trends make way more sense weekly than refreshing them constantly like you're day trading. Set up automated alerts for the really important thresholds so your dashboard actually helps instead of becoming another thing to babysit. Start simple and adjust based on what actually sparks useful discussions.
Culture is seriously everything when it comes to KPIs - like, I can't stress this enough. Teams with blame-heavy environments? People will just manipulate the numbers or completely ignore them because nobody wants to get thrown under the bus. You need that psychological safety where everyone sees metrics as learning tools, not gotcha moments. Getting your developers involved in picking which KPIs to track makes a huge difference. Oh, and never tie them to individual performance reviews - that's where things go sideways fast. Frame everything around team improvement and you'll actually see people embrace the data instead of running from it.
Start by actually talking to your stakeholders - sounds basic but teams constantly skip this part. Figure out what the business actually wants to achieve. Then map your DevOps metrics straight to those goals. Faster time-to-market? Track deployment frequency and lead time. Reliability matters more? Focus on MTTR and error rates instead. Honestly, the quarterly reviews with business leaders are clutch for staying on track. You've got to translate the technical stuff into business impact though - like showing how cutting deployment time by 50% helped beat competitors to market with that new feature.
So lead time tracks from idea to production, while cycle time just measures active dev work. Both are your best friends for spotting where stuff gets stuck in the pipeline. Way better than just counting how many times you deploy, honestly. Watch for lead time creeping up - that's your canary in the coal mine. I'd track both weekly if I were you. The patterns you'll start seeing are actually pretty eye-opening, and your team's delivery will get way more predictable. These metrics basically show how fast you're getting value to customers.
So tracking incident response metrics is honestly game-changing for making your DevOps setup more bulletproof. You'll want to monitor stuff like detection time, how long fixes take, and how often things break. This data shows you exactly where your weak spots are - maybe your monitoring is trash, or team handoffs drag on forever. I've seen it catch deployment patterns that consistently cause problems too. The best part? You can use all this to automate responses and tighten up your CI/CD pipeline. Just start simple with 2-3 key metrics on a dashboard so everyone can watch the trends.
Start by mapping your KPIs to what your team actually struggles with daily - don't just throw every metric on there. Group stuff that makes sense together, like pairing deployment frequency with lead time so patterns jump out. Different roles need different views too. Your devs shouldn't see the same exec-level stuff your manager cares about. Color coding helps but honestly? I went overboard once and created this hideous rainbow mess that nobody could read. Keep it simple. The real trick is watching what people actually reference in meetings and cutting the rest. Most dashboards have way too much noise anyway.
Oh man, this is so true! Start with the basics - deployment frequency and lead time work great for newer teams. You don't want to throw MTTR and error budgets at people who are still figuring out their pipeline, trust me. Once your team gets comfortable (honestly might take a few months), then you can add the fancy stuff like business impact measurements. I made this mistake before - tried tracking everything right away and it was a mess. Short sentences work better early on. Save the complex reliability metrics for when they've actually got their processes down.
Honestly, just stick with the DORA Four Key Metrics - they're the gold standard everyone uses. Deployment frequency, lead time for changes, change failure rate, and mean time to recovery. Elite teams are pushing code multiple times daily with lead times under an hour, which is pretty wild when you think about it. Meanwhile low performers deploy maybe once a month with lead times that drag on for months. Huge gap there. I'd also throw in uptime percentages and customer satisfaction scores because those tell the real story. Figure out where you're at first, then you can set actual targets that make sense.
-
The information is visually stunning and easy to understand, making it perfect for any business person. So I would highly recommend you purchase this PPT design now!
-
It makes easy work of my work presentations. I’ve never had to be nervous about my presentations for meetings.