

Devops tools kpi dashboard for monitoring software development




Try Before you Buy Download Free Sample Product
 Impress Your
Audience
 100%
Editable
 Save Hours
of Time


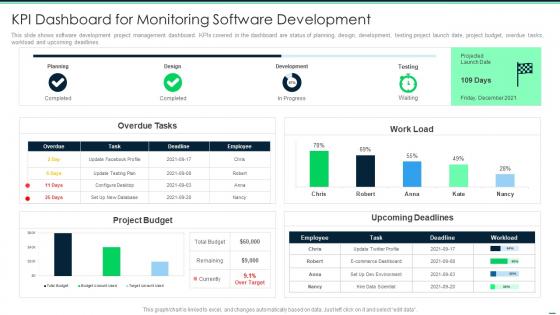
This slide shows software development project management dashboard. KPIs covered in the dashboard are status of planning, design, development, testing project launch date, project budget, overdue tasks, workload and upcoming deadlines.
People who downloaded this PowerPoint presentation also viewed the following :
Devops tools kpi dashboard for monitoring software development with all 7 slides:
Use our DevOps Tools KPI Dashboard For Monitoring Software Development to effectively help you save your valuable time. They are readymade to fit into any presentation structure.






FAQs for Devops tools kpi dashboard for
Stick with the core DORA metrics first - deployment frequency, lead time, mean time to recovery, and change failure rate. System uptime and error rates are solid additions too. Honestly, I've watched teams create these massive dashboards with like 20 metrics that just sit there collecting digital dust. Nobody actually uses them. Keep it to 6-8 metrics tops, stuff that directly connects to what your team's trying to accomplish. You can always add business KPIs later if leadership starts asking for them. Start simple and build from there - way easier than trying to boil down a bloated dashboard later.
So basically, a DevOps dashboard stops all that back-and-forth nonsense between dev and ops teams. Everyone sees the same stuff - build status, performance metrics, system health, whatever matters to your workflow. Your devs can actually watch how their code behaves in production instead of just hoping for the best. Ops gets to track deployment frequency and failure rates without having to dig around. The whole transparency thing cuts down on the blame game big time. Honestly, once you set it up with metrics both teams care about, you'll notice people start working together way more naturally. It's like having one shared scoreboard instead of everyone keeping their own score.
So the big three are Grafana, Datadog, and New Relic. Grafana's open-source which is nice - you can basically visualize whatever you want if you hook up the right data sources. Datadog kills it for infrastructure monitoring, their dashboards look great right out of the box. New Relic's more focused on application performance and does error tracking really well. I've been using Grafana lately and wow, once you get the hang of it the thing is insane. Oh and Kibana's decent too if you're already running ELK. Really just depends on what you're already using and how much you want to spend.
Dude, real-time dashboards are a game changer. You'll catch problems before they blow up instead of finding out hours later from angry users. Seeing your pipeline and metrics update live? Chef's kiss. Deploy something, then watch immediately if it worked or made things worse. The trick is only alerting on stuff that actually matters to your goals - learned that the hard way after getting pinged every 5 minutes for random CPU spikes. But honestly, there's something weirdly satisfying about watching those green lights stay green. Makes you feel like you've got everything dialed in, even when chaos is probably lurking somewhere.
Start with the basics - deployment frequency, lead time, failure rates. Don't try cramming everything on one screen, you'll just confuse people. Make your critical alerts super obvious with visual hierarchy. Honestly, skip the fancy colors and widgets - they're usually distracting anyway. Keep time ranges the same across all charts so teams can actually compare stuff. Group related metrics together and make sure it loads quickly. Nobody's got patience for slow dashboards when systems are breaking. Oh, and definitely test with real users first - what looks good to you might be totally useless to them.
Dude, once you hook up CI/CD tools to your DevOps dashboard, it becomes this crazy control center for everything. Build statuses, deployments, release metrics - it's all right there instead of jumping between tabs like a maniac. Honestly made my life so much easier. You can spot where things are getting stuck, see which deployments actually worked, and even kick off builds or roll stuff back without leaving the dashboard. Oh, and don't try to integrate everything at once - that's a nightmare. Just start with whatever's breaking most often and build from there.
Dude, incident management is like having a command center for when everything breaks. Real-time alerts ping you when stuff goes wrong, plus you can track outage times and see which services are constantly failing. Those 3am calls still suck, but at least you're not flying blind. Your dashboard lets you assign problems to the right people and spot weird patterns - sometimes you'll notice the same issue keeps popping up. Honestly, just start with automated alerts for your critical stuff first. Way better to catch problems before your customers start complaining on Twitter.
So basically a DevOps dashboard shows you all your system stuff in real-time - response times, CPU, memory, error rates. Way better than getting woken up at 2am by alerts, trust me on that one. You can track trends to see if your new deployment actually helped or just broke everything worse. Set alerts for the important thresholds and use that historical data when you're deciding about scaling. Oh, and don't go crazy at first - just pick your top 3-5 critical metrics and build from there. You'll thank yourself later.
Start with access controls - only show people data they actually need for their job. SSO with MFA is your friend here. Seriously, don't put sensitive stuff like API keys or passwords on the dashboard (you'd be shocked how often this happens). Encrypt everything in transit and at rest. Audit logs are clutch for tracking who looked at what. Lock it down to your corporate network or VPN too. Honestly? Just do a quick review first of what you're actually putting out there. That'll tell you where the real risks are.
For tracking DevOps metrics, I'd go with trend lines showing deployment frequency, lead time, and failure rates over time. Heat maps are clutch for spotting patterns - you'll probably notice Mondays are cursed for deployments lol. Stack your main metrics vertically so you can easily see how they connect. Comparison views help too, like current vs last month. Don't forget annotations for big releases or when stuff breaks. Honestly, the whole point is making it obvious if you're getting better or worse. Set up some alerts when things start trending downhill - way better to catch problems early than explain them later.
Honestly, go with a centralized dashboard first. You'll catch issues and patterns across teams that nobody sees when everyone's stuck in their own little bubble. Your boss will thank you for having one spot to check instead of jumping between tools all day - I learned that the hard way lol. Yeah, it gets messy sometimes and teams complain about losing their custom views. But here's what works: keep the main dashboard simple for high-level stuff, then link out to individual team boards when people need the nitty-gritty details. Individual dashboards are solid for deep dives but miss dependencies between teams completely.
Just ask them directly! Set up monthly surveys or quick Slack polls about what's working. Users will literally tell you exactly what they need - you just have to listen. Track which metrics they actually click on vs what you think matters. Remove widgets nobody uses (be ruthless about this). Analytics on the dashboard itself shows where people spend time. Oh and make feedback super easy - even thumbs up/down buttons work. I'd start with one method this week. Don't overthink it.
Track deployments per day/week and your success rates first - that's your baseline. Commit-to-deploy time matters too, plus how long PRs sit in review and build times. Honestly, MTTR is non-negotiable because stuff will break, it's not if but when. Change failure rate shows whether you're actually getting better or just deploying more garbage. Those four DORA metrics are solid foundations. After that, add pipeline stuff like queue waits or how much you're automating vs doing manually. Get the automated collection working first though - building dashboards around data you don't consistently capture is just frustrating yourself.
So basically you want different views for different people, right? Executives care about the big picture stuff - deployment frequency, uptime, that kind of thing. Developers need the nitty gritty: build failures, code quality, pipeline status. Operations teams are all about infrastructure health and how fast they can respond to incidents (honestly, they're kind of obsessed with response times). Most tools let you set up role-based access so everyone just sees their relevant stuff. You can mess around with filters and custom widgets too. My advice? Just ask each team what they actually look at every day - saves you from guessing what matters to them.
There's a few solid ways to get ML working in your DevOps dashboard. Predictive failure detection is huge - the models look at your deployment history, system metrics, and error logs to spot when builds might tank. Capacity forecasting helps you plan scaling before you actually need it. Anomaly detection catches weird stuff automatically too. Oh, and it can do root cause analysis and figure out the best deployment windows based on traffic patterns - that part's actually really slick. I'd start with just build failure prediction though. Way easier to prove it works before you go all-in on everything else.
-
Unique and attractive product design.
-
Very well designed and informative templates.