Distressed Debt Restructuring Powerpoint Presentation Slides
Introducing Distressed Debt Restructuring PowerPoint Presentation Slides. The agenda of this presentation is to analyze multiple methods to repay credits and to understand and implement the debt reconstructing strategy and process. The presentation provides an overview of the organization, its services, and its financial performance. These financial parameters can be revenues, gross profit, net profit, and earnings per share. Perform an in-depth analysis of its current financial performance with the help of corporate debt reconstructing PPT layouts. Also, showcase the key aspects of the performance that are covered such as the Income Statement, balance sheet, cash flow statement, and other key ratios, etc. Analyze multiple options that can help the organization recover from its debts by using this debt reconstructing PPT slide deck. Evaluate the impact of debt restructuring and decide multiple KPIs Key performance indicators to study the overall effect of debt restructuring by incorporating CDR PPT layouts.
- Google Slides is a new FREE Presentation software from Google.
- All our content is 100% compatible with Google Slides.
- Just download our designs, and upload them to Google Slides and they will work automatically.
- Amaze your audience with SlideTeam and Google Slides.
-
Want Changes to This PPT Slide? Check out our Presentation Design Services
- WideScreen Aspect ratio is becoming a very popular format. When you download this product, the downloaded ZIP will contain this product in both standard and widescreen format.
-

- Some older products that we have may only be in standard format, but they can easily be converted to widescreen.
- To do this, please open the SlideTeam product in Powerpoint, and go to
- Design ( On the top bar) -> Page Setup -> and select "On-screen Show (16:9)” in the drop down for "Slides Sized for".
- The slide or theme will change to widescreen, and all graphics will adjust automatically. You can similarly convert our content to any other desired screen aspect ratio.
Compatible With Google Slides

Get This In WideScreen
You must be logged in to download this presentation.
PowerPoint presentation slides
Presenting Distressed Debt Restructuring Powerpoint Presentation Slides. This PPT layout is compatible with Google Slides. You can download this PPT theme in various formats like PDF, PNG, and JPG. This PowerPoint template is completely editable and you can modify the font size, font type, and shapes as per your requirements. This PPT slide is available in 4:3 and 16:9 aspect ratios
People who downloaded this PowerPoint presentation also viewed the following :
Content of this Powerpoint Presentation
Slide 1: This slide introduces Distressed Debt Restructuring. State your Company name.
Slide 2: This slide shows Corporate Debt Restructuring Objectives.
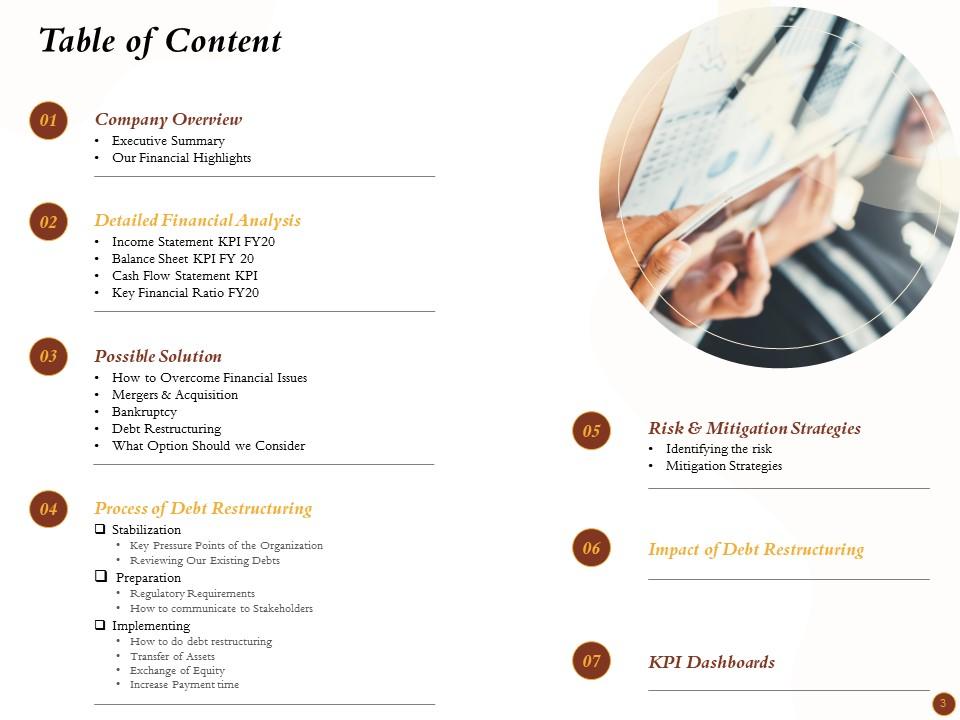
Slide 3: This slide shows Table of Content
Slide 4: This slide displays Table of Content
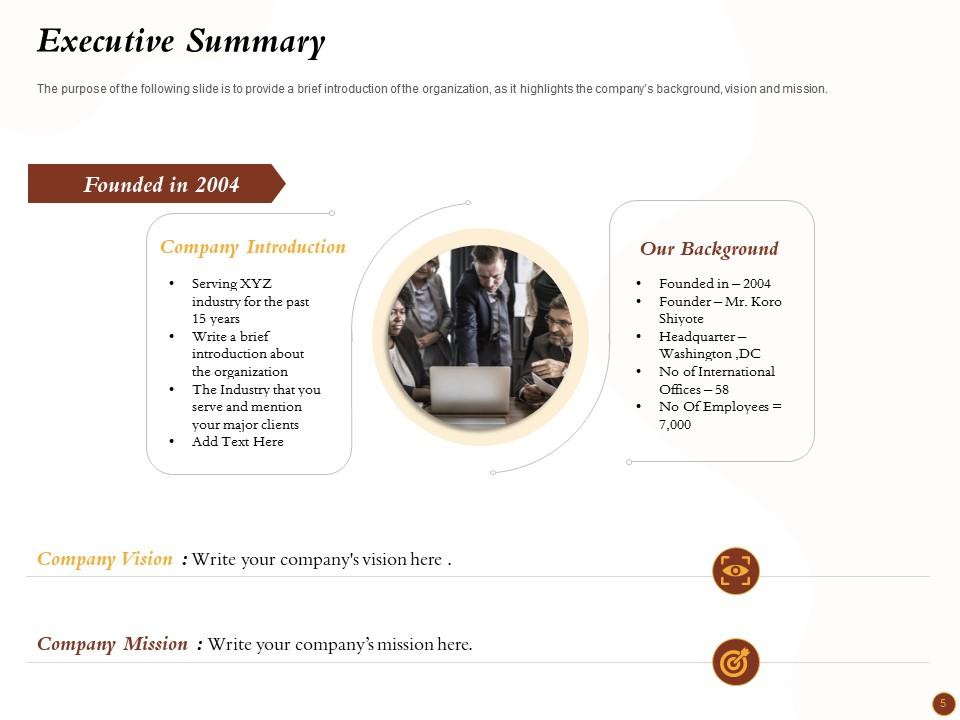
Slide 5: The purpose of the following slide is to provide a brief introduction of the organization, as it highlights the company’s background, vision and mission.
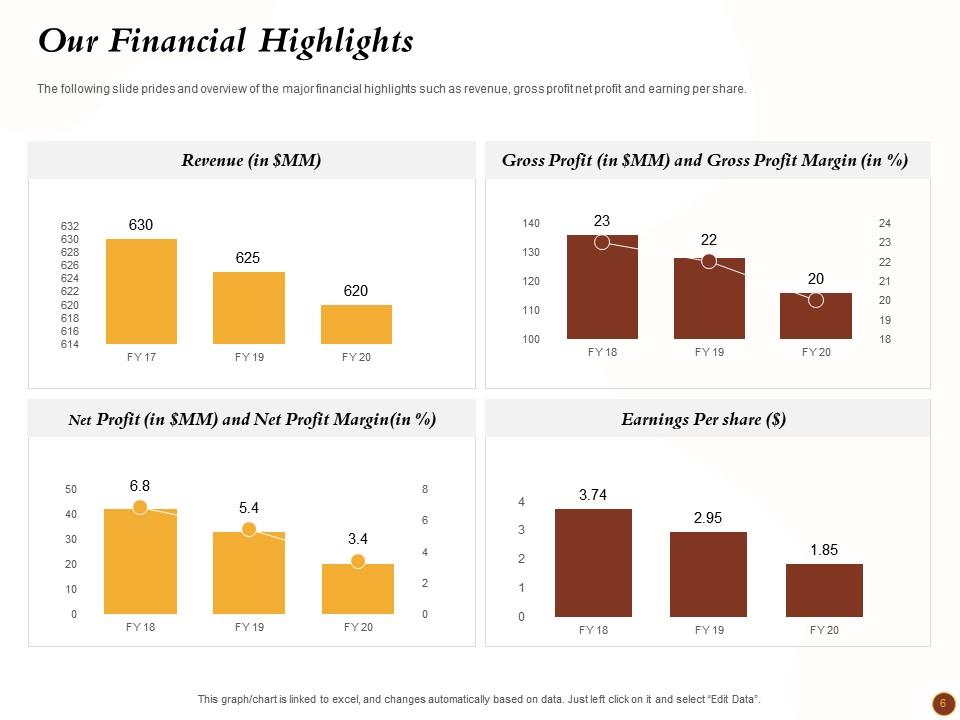
Slide 6: The following slide prides and overview of the major financial highlights such as revenue, gross profit net profit and earning per share.
Slide 7: This slide displays Detailed Financial Analysis
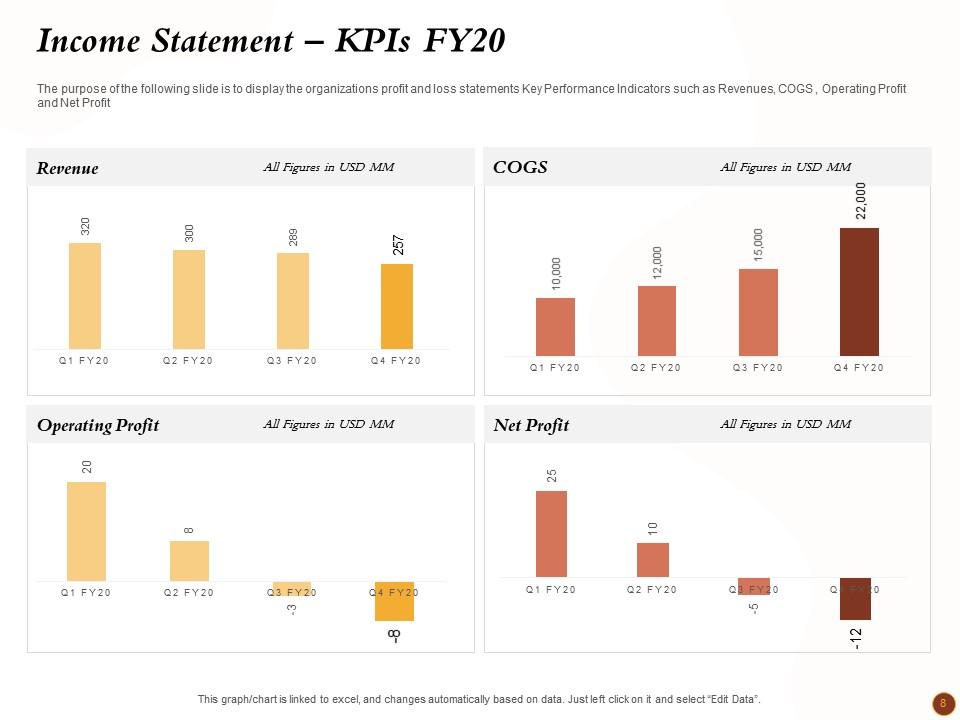
Slide 8: The purpose of the following slide is to display the organizations profit and loss statements Key Performance Indicators such as Revenues, COGS , Operating Profit and Net Profit
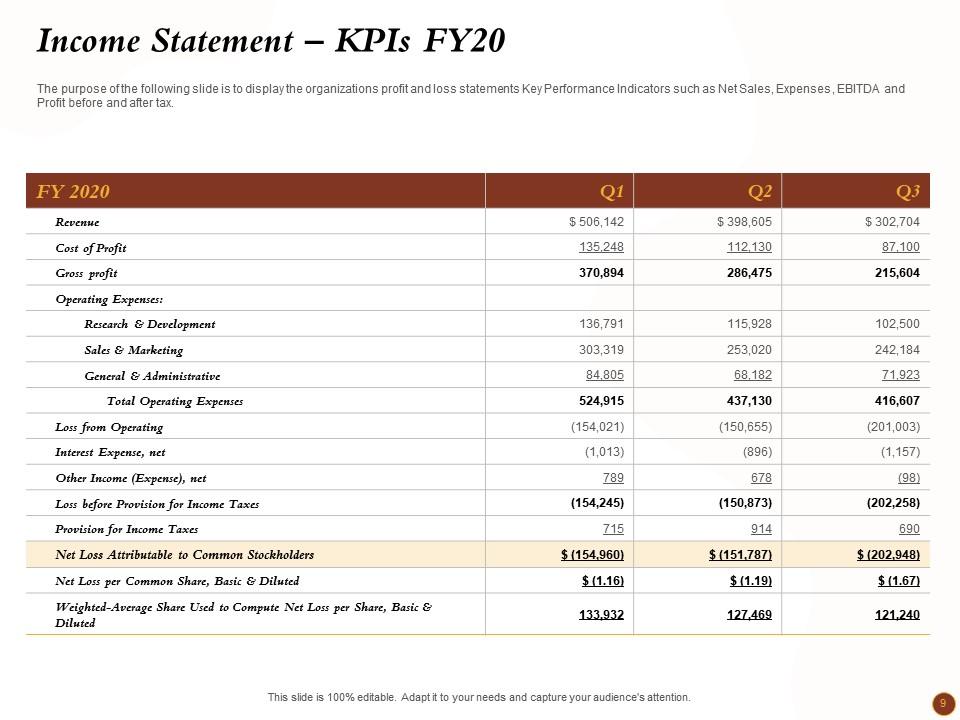
Slide 9: The purpose of the following slide is to display the organizations profit and loss statements Key Performance Indicators such as Net Sales, Expenses , EBITDA and Profit before and after tax.
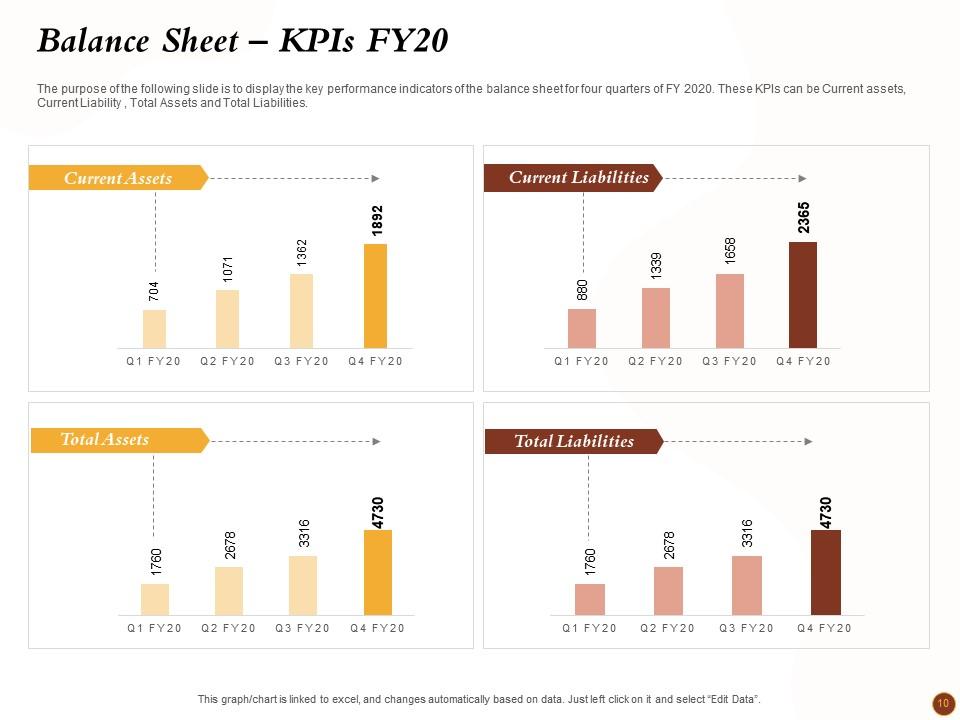
Slide 10: The purpose of the following slide is to display the key performance indicators of the balance sheet for four quarters of FY 2020. These KPIs can be Current assets, Current Liability , Total Assets and Total Liabilities.
Slide 11: The purpose of the following slide is to display the key performance indicators of the balance sheet for four quarters of FY 2020. These KPIs can be Current assets, Current Liability , Total Assets and Total Liabilities.
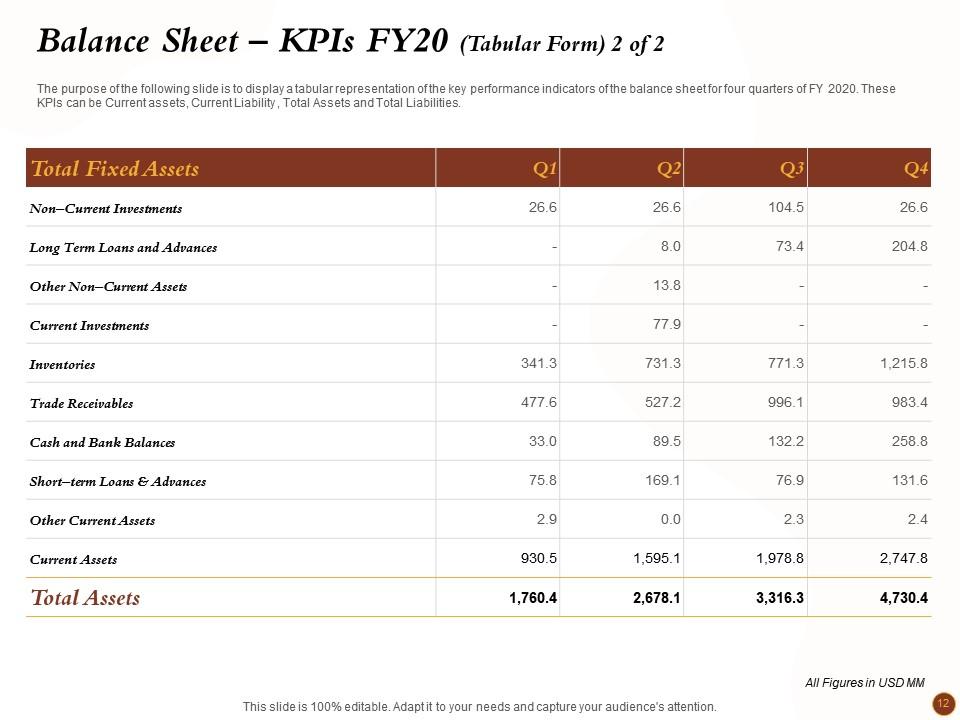
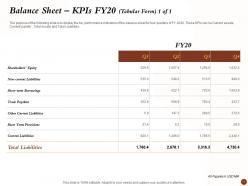
Slide 12: The purpose of the following slide is to display a tabular representation of the key performance indicators of the balance sheet for four quarters of FY 2020. These KPIs can be Current assets, Current Liability , Total Assets and Total Liabilities.
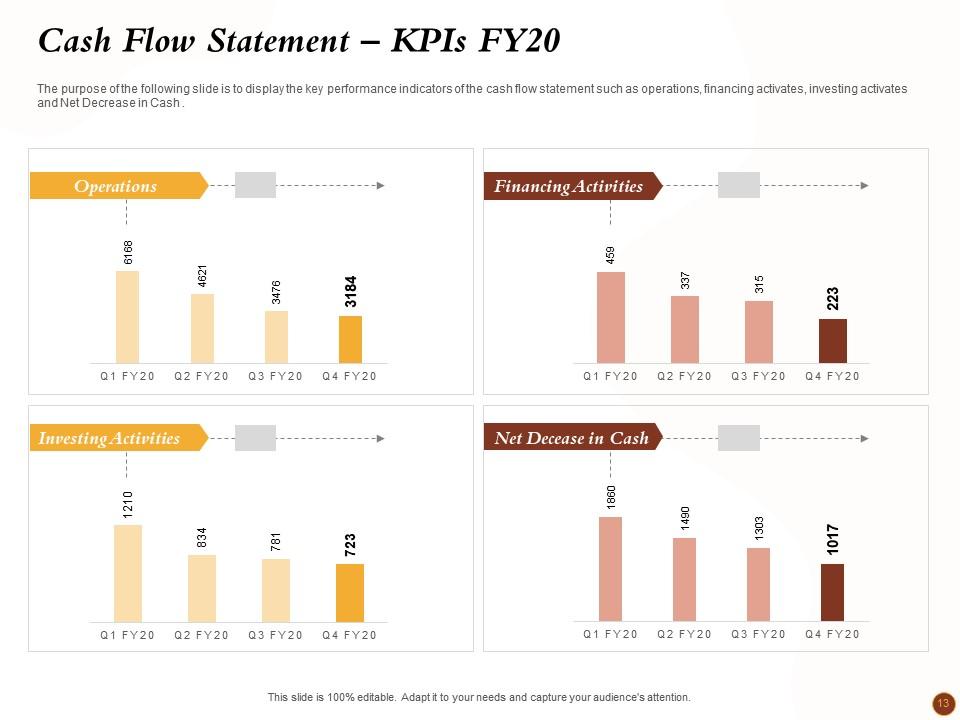
Slide 13: The purpose of the following slide is to display the key performance indicators of the cash flow statement such as operations, financing activates, investing activates and Net Decrease in Cash .
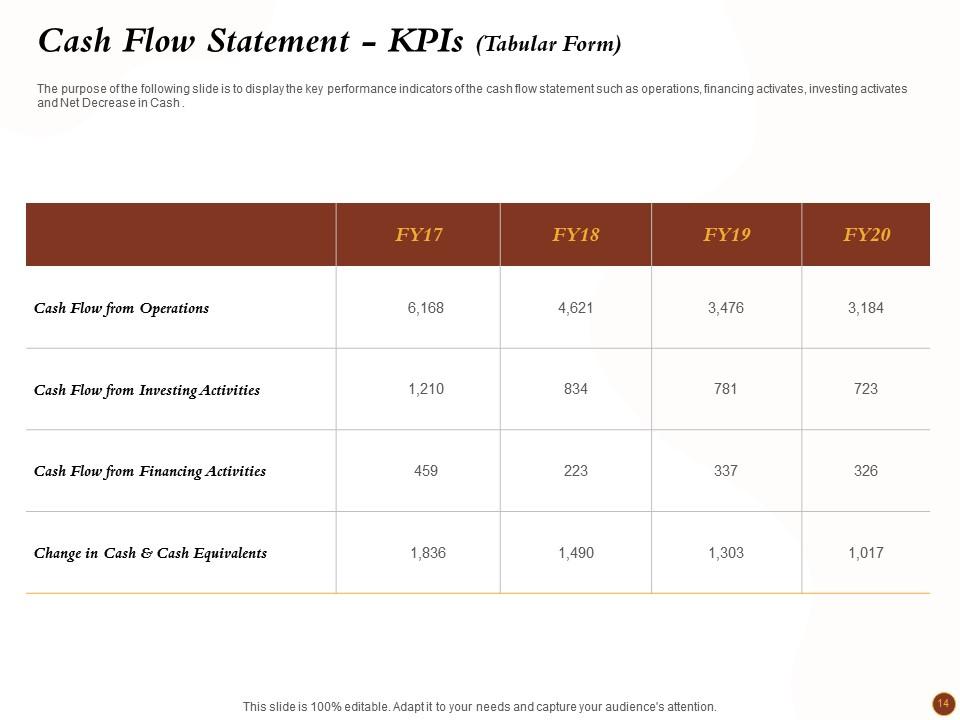
Slide 14: The purpose of the following slide is to show a tabular representation of the major KPIs of the cash flow statement of the previous 4 years.
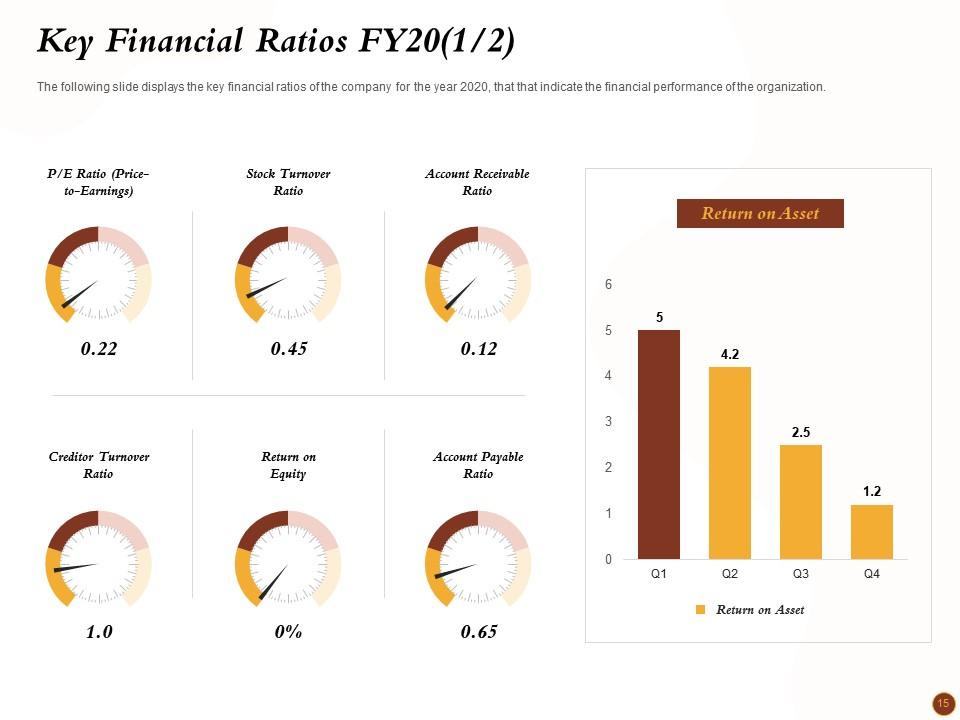
Slide 15: The following slide displays the key financial ratios of the company for the year 2020, that that indicate the financial performance of the organization.
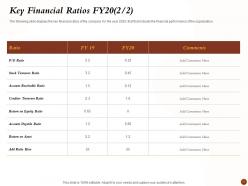
Slide 16: The following slide displays the key financial ratios of the company for the year 2020, that that indicate the financial performance of the organization.
Slide 17: This slide shows Table of Content
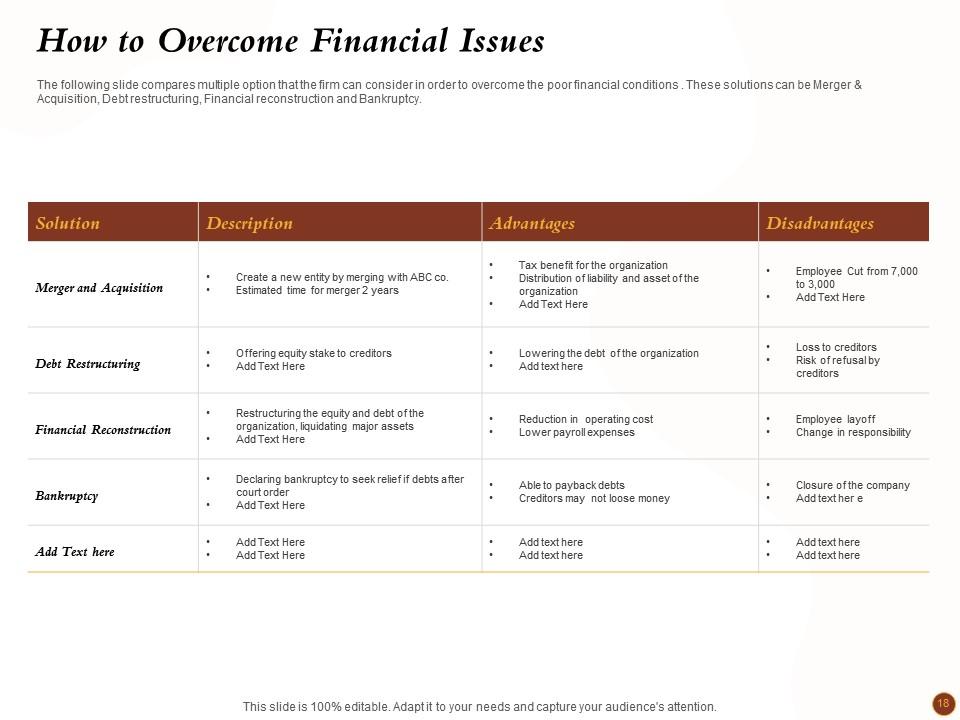
Slide 18: The following slide compares multiple option that the firm can consider in order to overcome the poor financial conditions . These solutions can be Merger & Acquisition, Debt restructuring, Financial reconstruction and Bankruptcy.
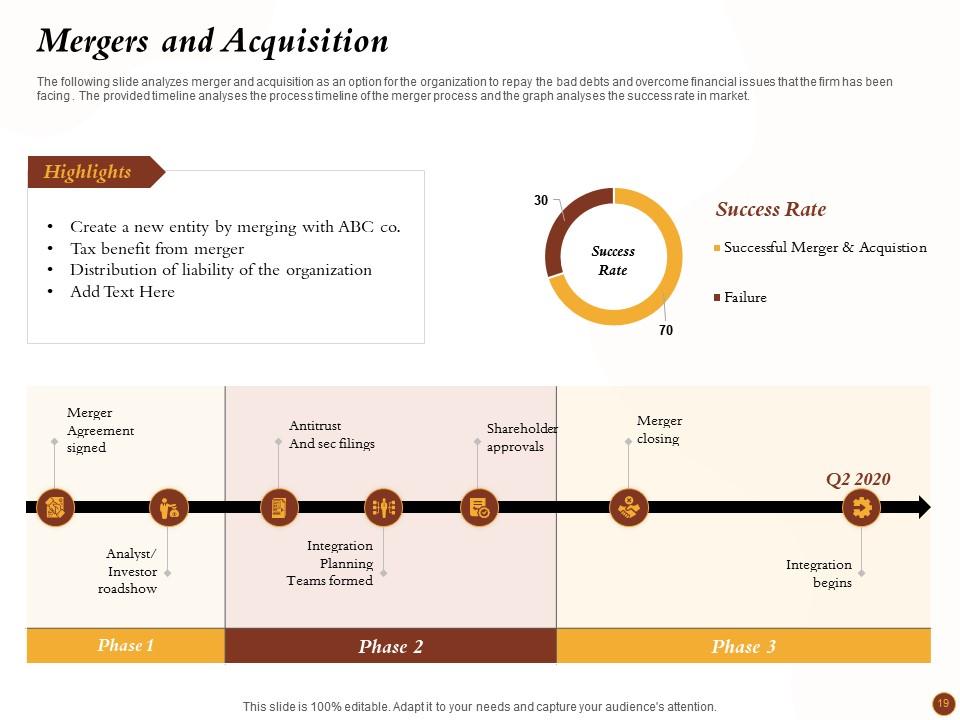
Slide 19: This slide analyzes merger and acquisition as an option for the organization to repay the bad debts and overcome financial issues that the firm has been facing . The provided timeline analyses the process timeline of the merger process and the graph analyses the success rate in market.
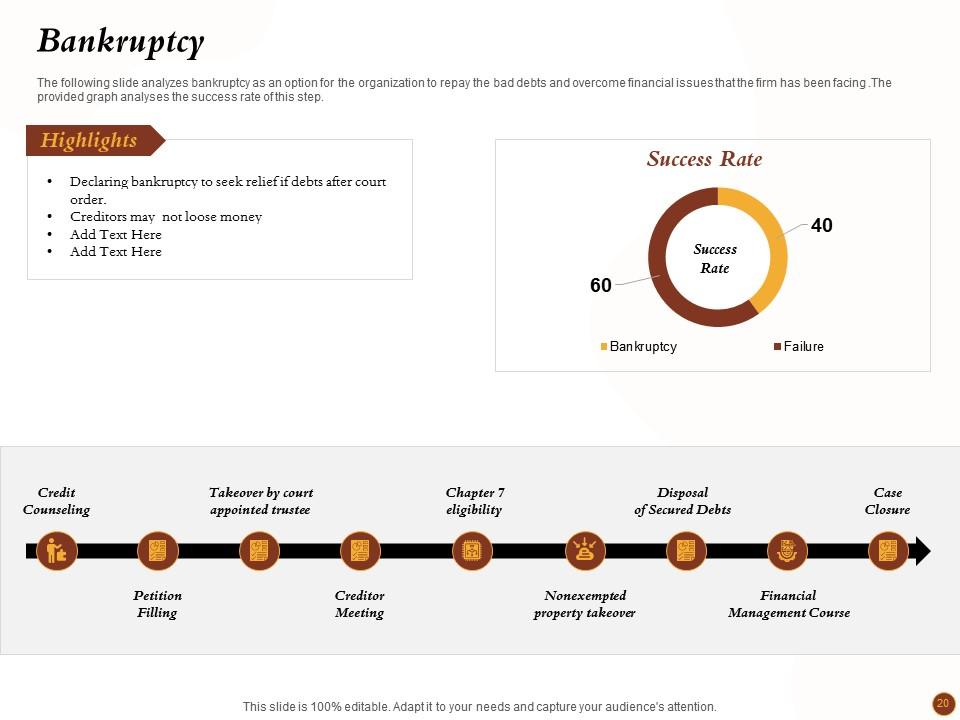
Slide 20: This slide analyzes bankruptcy as an option for the organization to repay the bad debts and overcome financial issues that the firm has been facing .The provided graph analyses the success rate of this step.
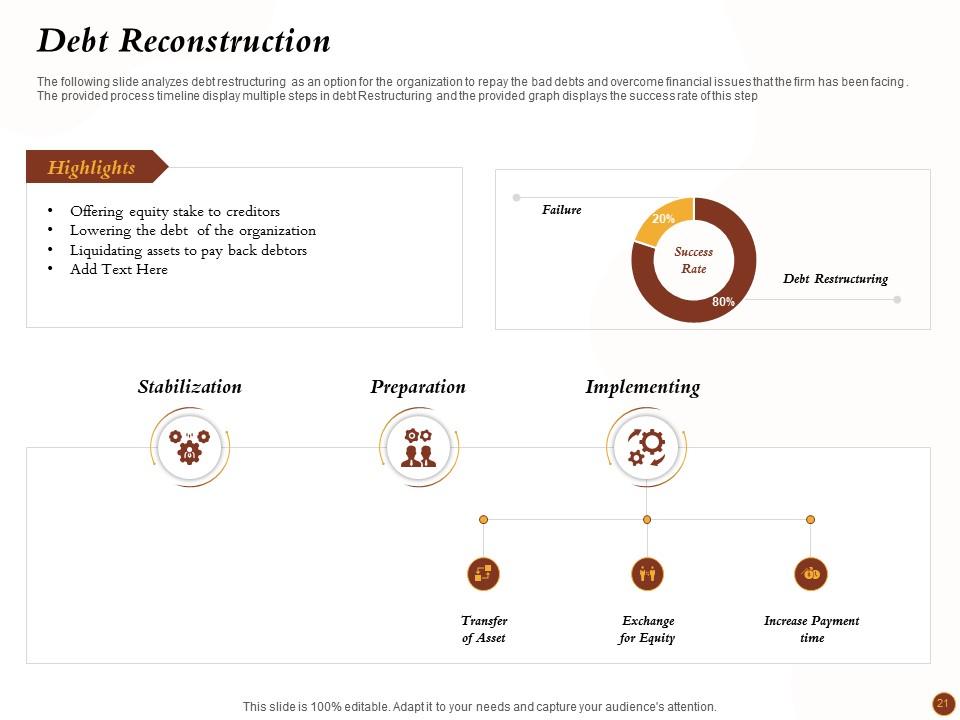
Slide 21: The following slide analyzes debt restructuring as an option for the organization to repay the bad debts and overcome financial issues that the firm has been facing . The provided process timeline display multiple steps in debt Restructuring and the provided graph displays the success rate of this step
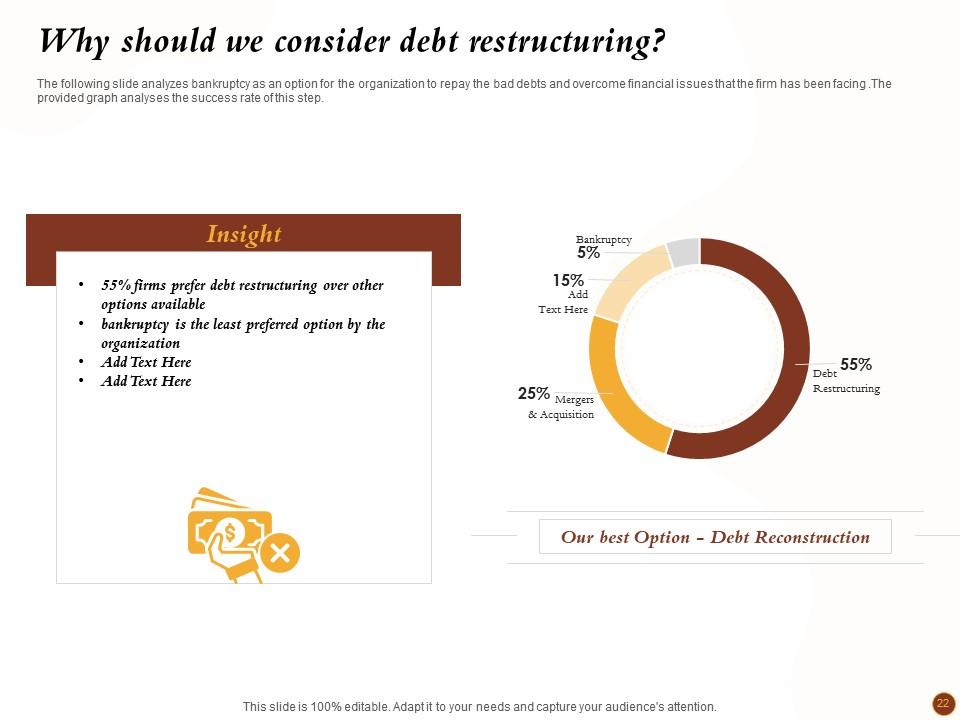
Slide 22: The following slide analyzes debt restructuring as an option for the organization to repay the bad debts and overcome financial issues that the firm has been facing . The provided process timeline display multiple steps in debt Restructuring and the provided graph displays the success rate of this step
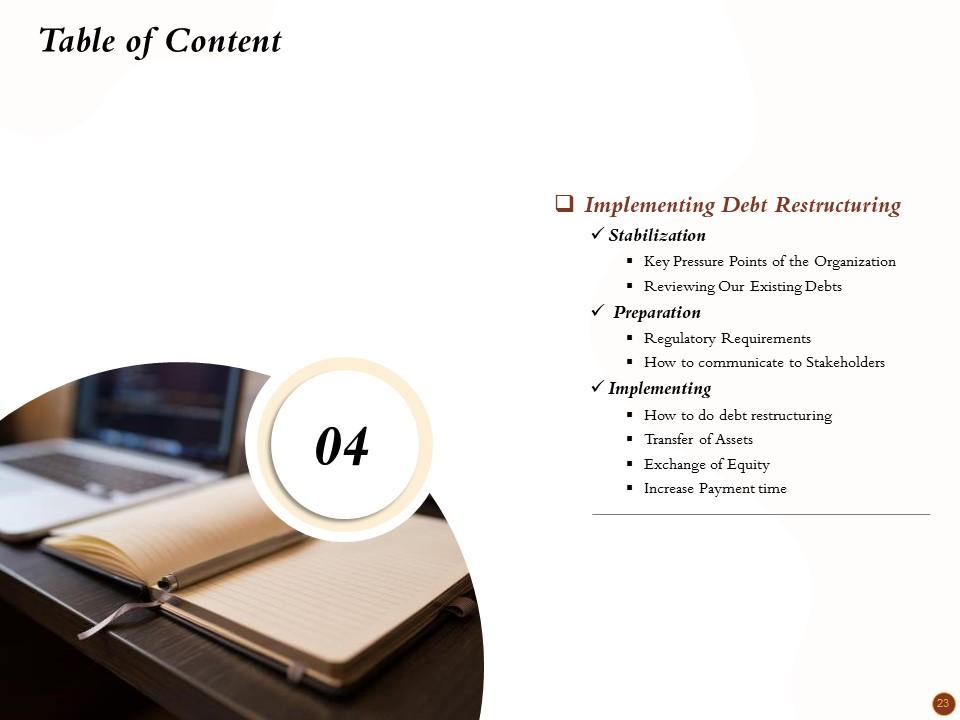
Slide 23: This slide provides Table of Content
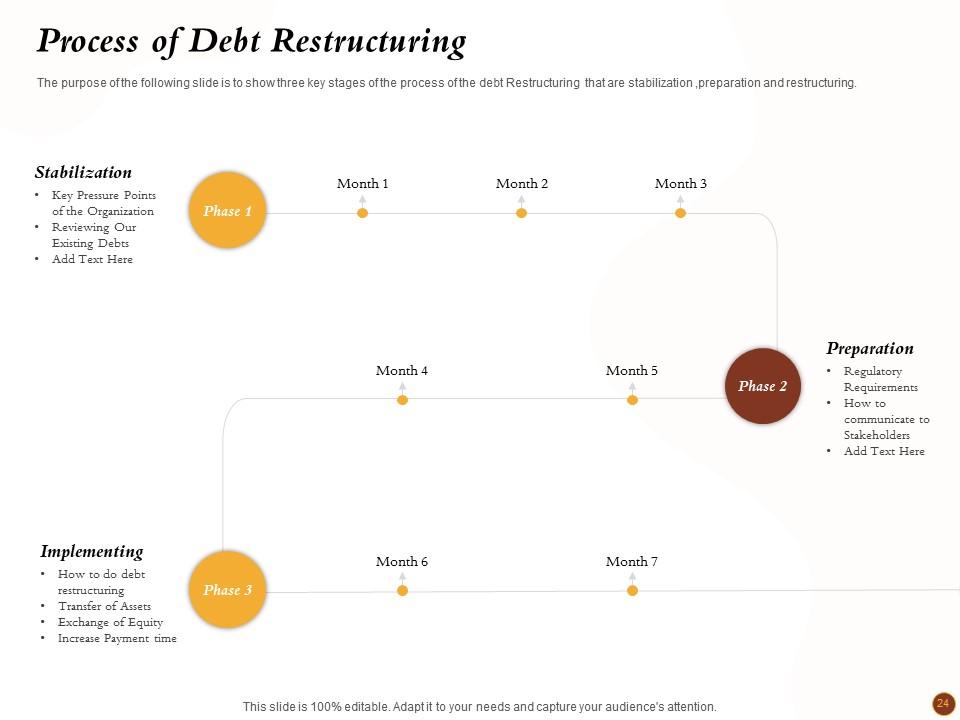
Slide 24: The purpose of the following slide is to show three key stages of the process of the debt Restructuring that are stabilization ,preparation and restructuring
Slide 25: This slide shows Table of Content
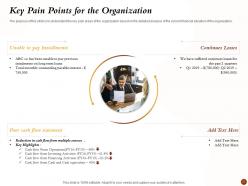
Slide 26: The purpose of this slide is to understand the key pain areas of the organization based on the detailed analysis of the current financial situation of the organization
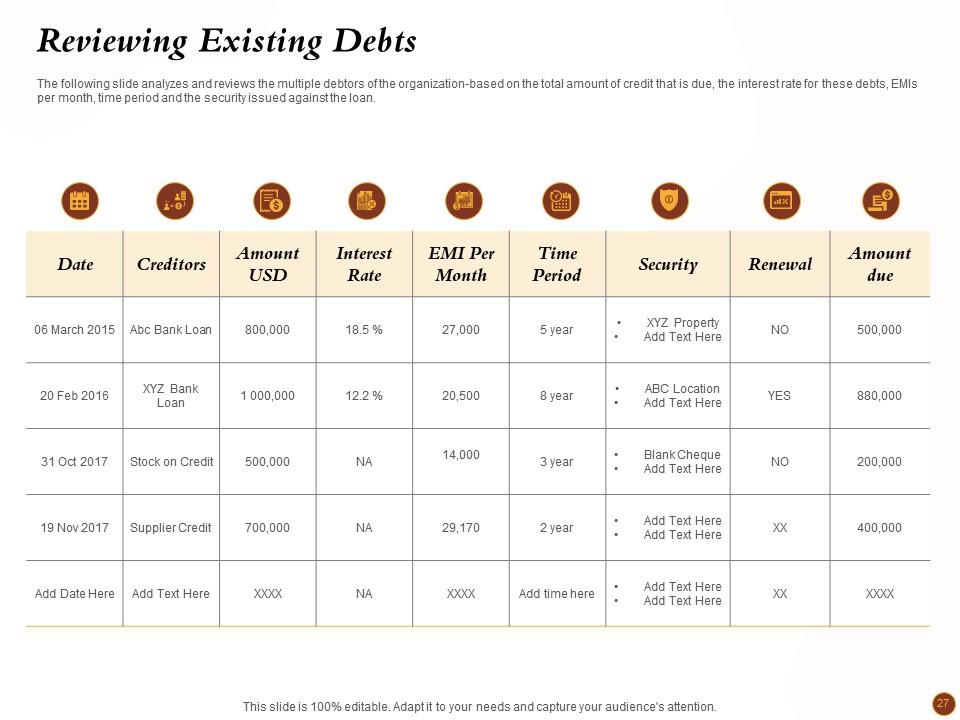
Slide 27: The following slide analyzes and reviews the multiple debtors of the organization-based on the total amount of credit that is due, the interest rate for these debts, EMIs per month, time period and the security issued against the loan.
Slide 28: This slide displays Table of Content
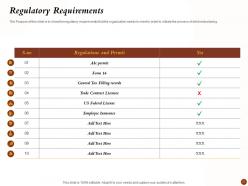
Slide 29: The Purpose of this slide is to show the regulatory requirements that the organization needs to meet in order to initiate the process of debt restructuring.
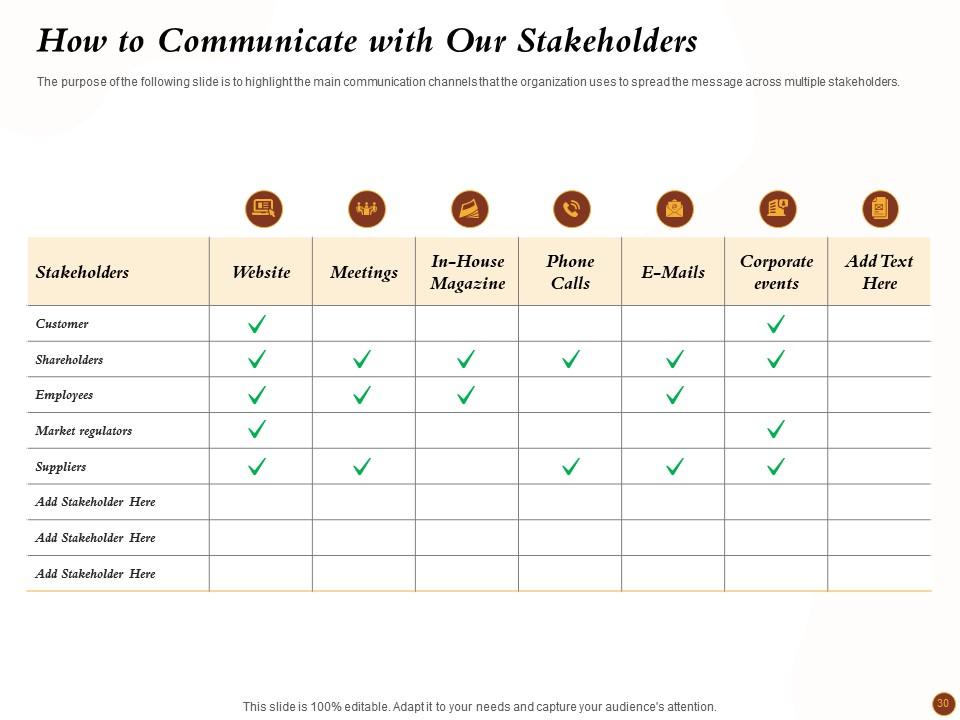
Slide 30: The purpose of the following slide is to highlight the main communication channels that the organization uses to spread the message across multiple stakeholders.
Slide 31: This slide displays Table of Content
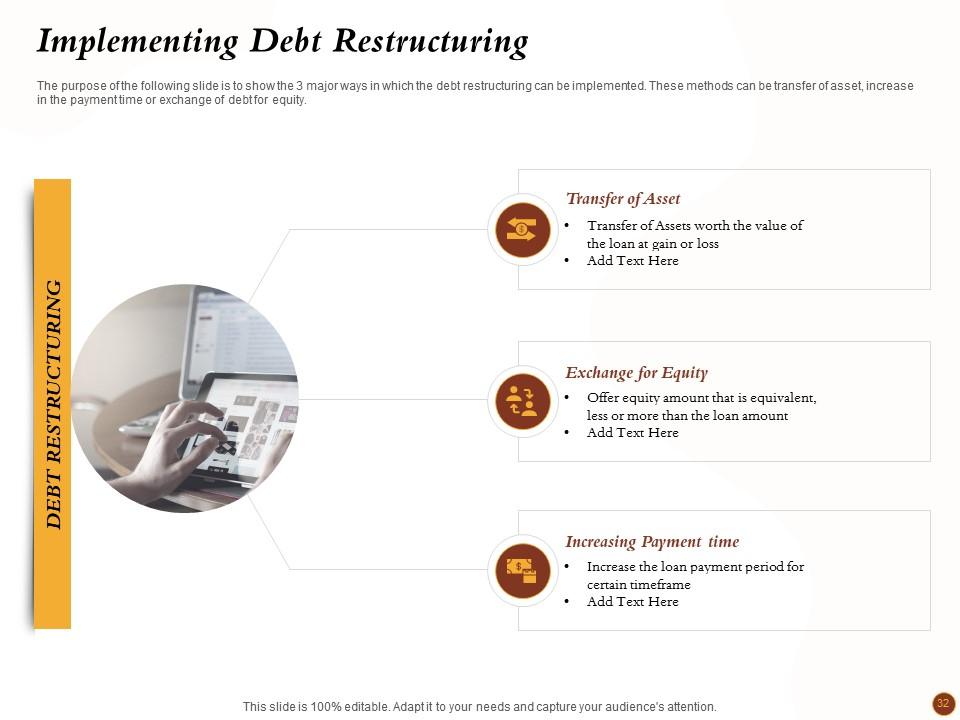
Slide 32: The purpose of the following slide is to show the 3 major ways in which the debt restructuring can be implemented. These methods can be transfer of asset, increase in the payment time or exchange of debt for equity
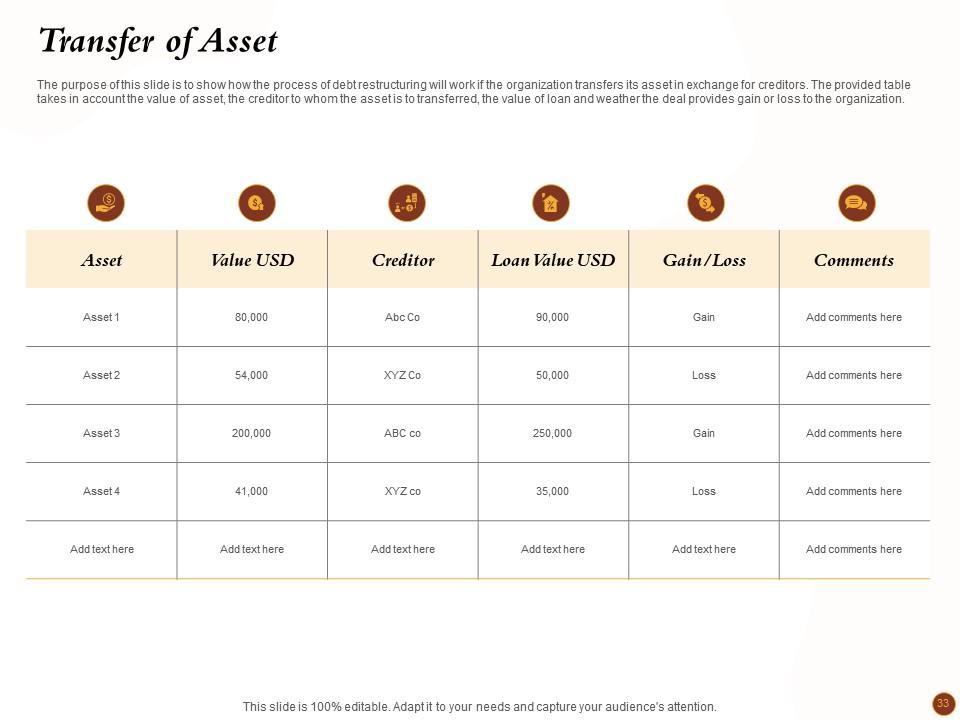
Slide 33: The purpose of this slide is to show how the process of debt restructuring will work if the organization transfers its asset in exchange for creditors. The provided table takes in account the value of asset, the creditor to whom the asset is to transferred, the value of loan and weather the deal provides gain or loss to the organization.
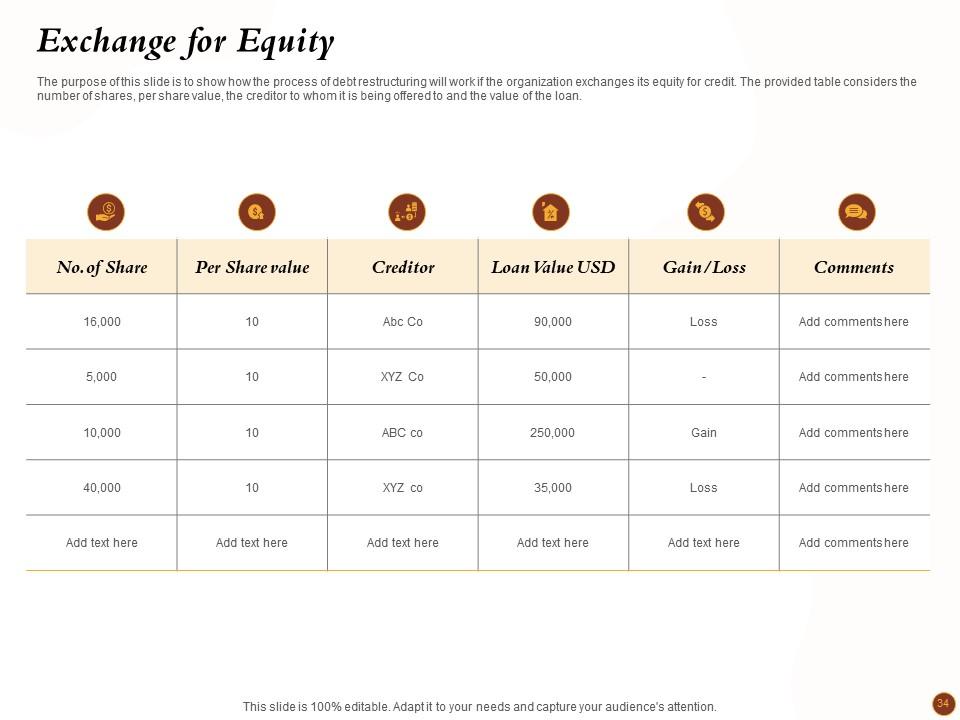
Slide 34: The purpose of this slide is to show how the process of debt restructuring will work if the organization exchanges its equity for credit. The provided table considers the number of shares, per share value, the creditor to whom it is being offered to and the value of the loan.
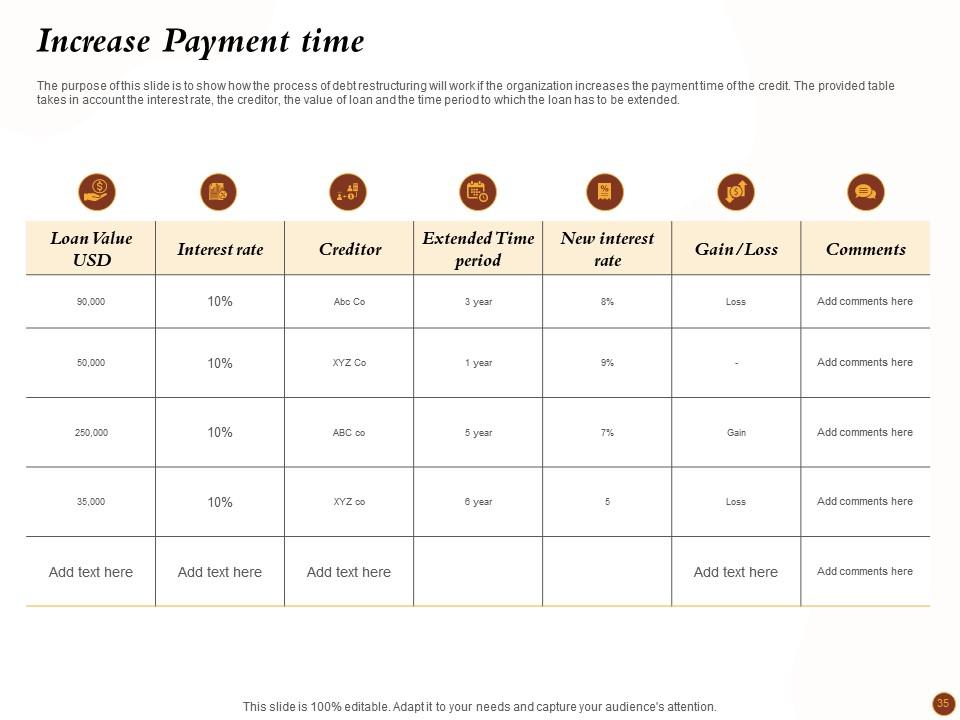
Slide 35: The purpose of this slide is to show how the process of debt restructuring will work if the organization increases the payment time of the credit. The provided table takes in account the interest rate, the creditor, the value of loan & the time period to which the loan has to be extended
Slide 36: This slide shows Table of Content.
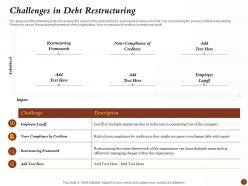
Slide 37: The purpose of the following slide is to analyze the impact of the and likelihood and impact of various risk that may occur during the process of debt restructuring. These risk can be Restructuring framework of the organization, Non-compliance of creditors or employee layoff.
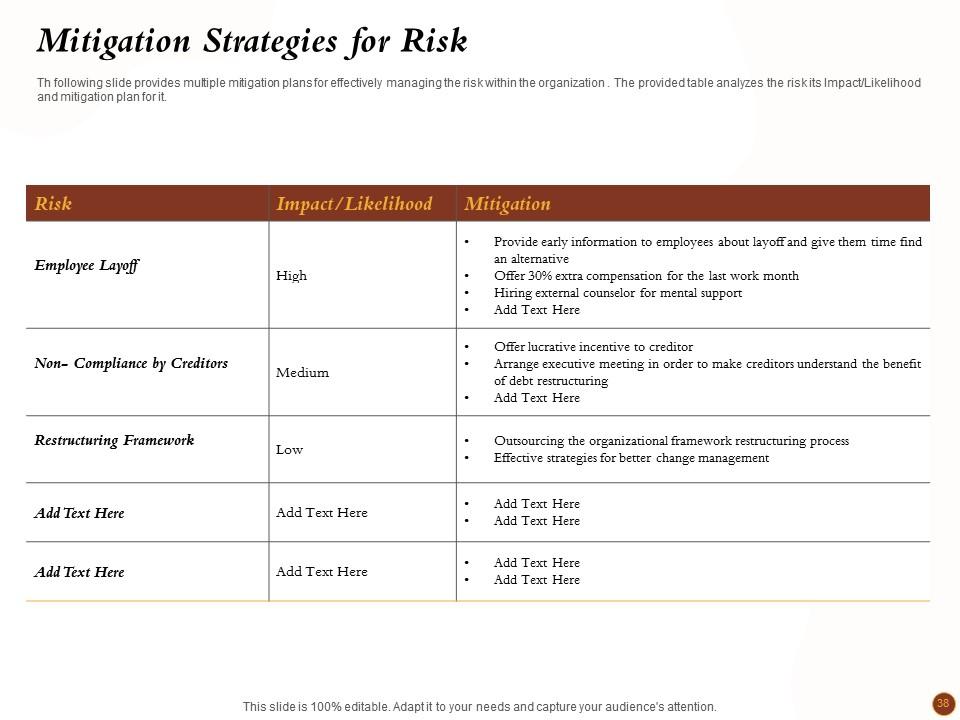
Slide 38: This slide provides multiple mitigation plans for effectively managing the risk within the organization . The provided table analyzes the risk its Impact/Likelihood and mitigation plan for it.
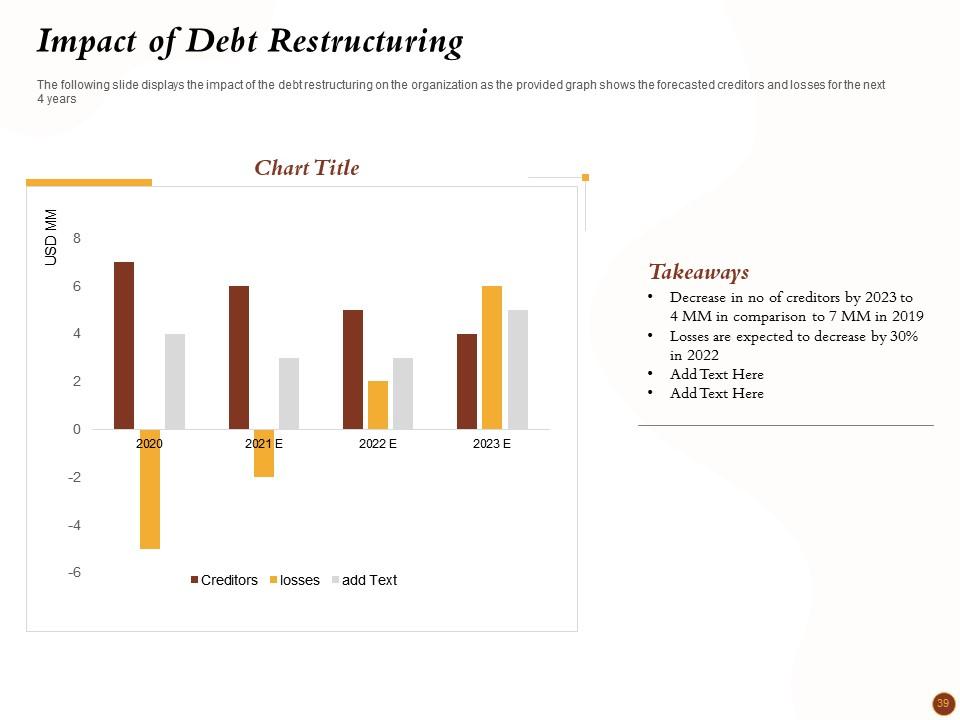
Slide 39: This slide displays the impact of the debt restructuring on the organization as the provided graph shows the forecasted creditors and losses for the next 4 years
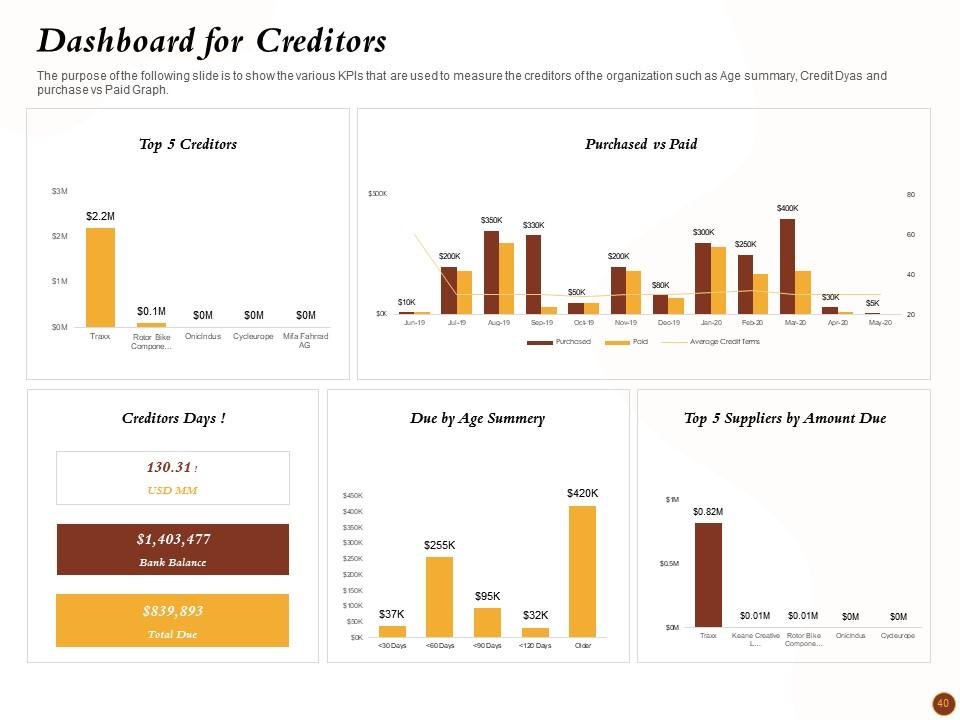
Slide 40: The purpose of the following slide is to show the various KPIs that are used to measure the creditors of the organization such as Age summary, Credit Dyas and purchase vs Paid Graph.
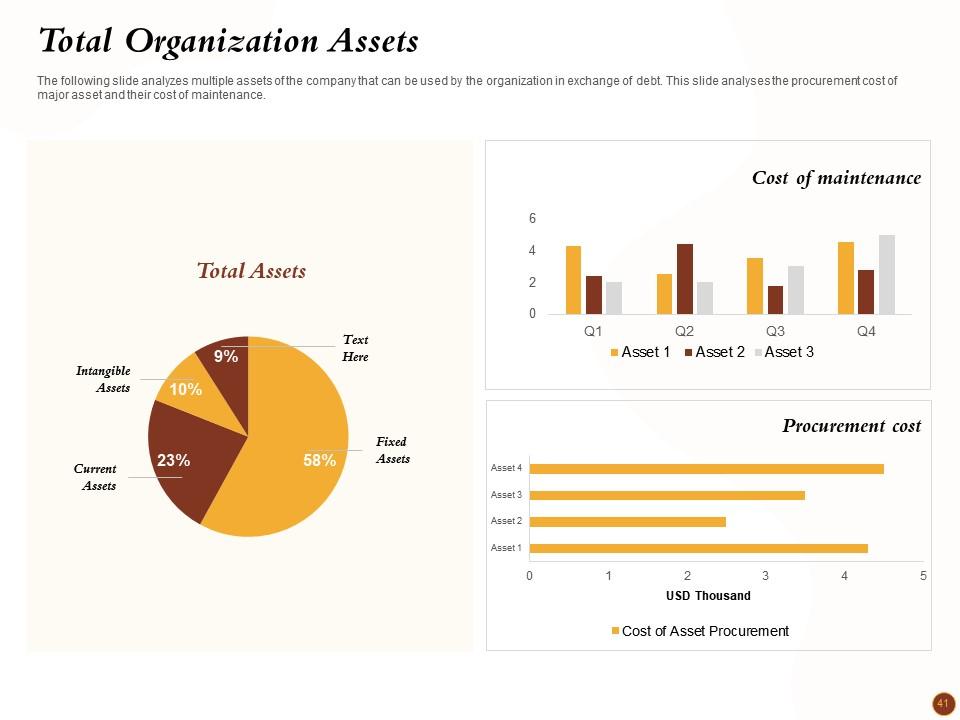
Slide 41: This slide analyzes multiple assets of the company that can be used by the organization in exchange of debt. This slide analyses the procurement cost of major asset and their cost of maintenance.
Slide 42: This is Destressed Debt Restructuring Icons Slide.
Slide 43: This slide is titled as Additional Slides for moving forward.
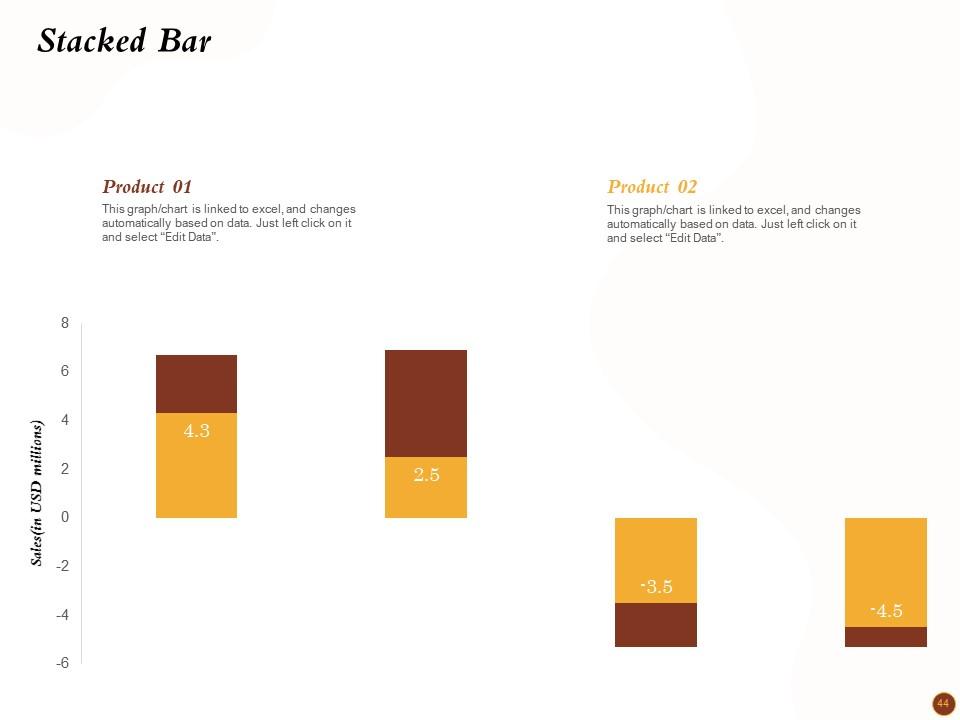
Slide 44: This slide displays Stacked Bar chart for comparison of products.
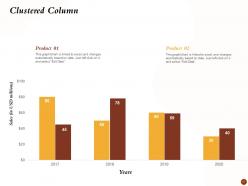
Slide 45: This slide shows Clustered Column chart for product comparison.
Slide 46: This slide displays Goals.
Slide 47: This slide shows Mission, Vision and Goals.
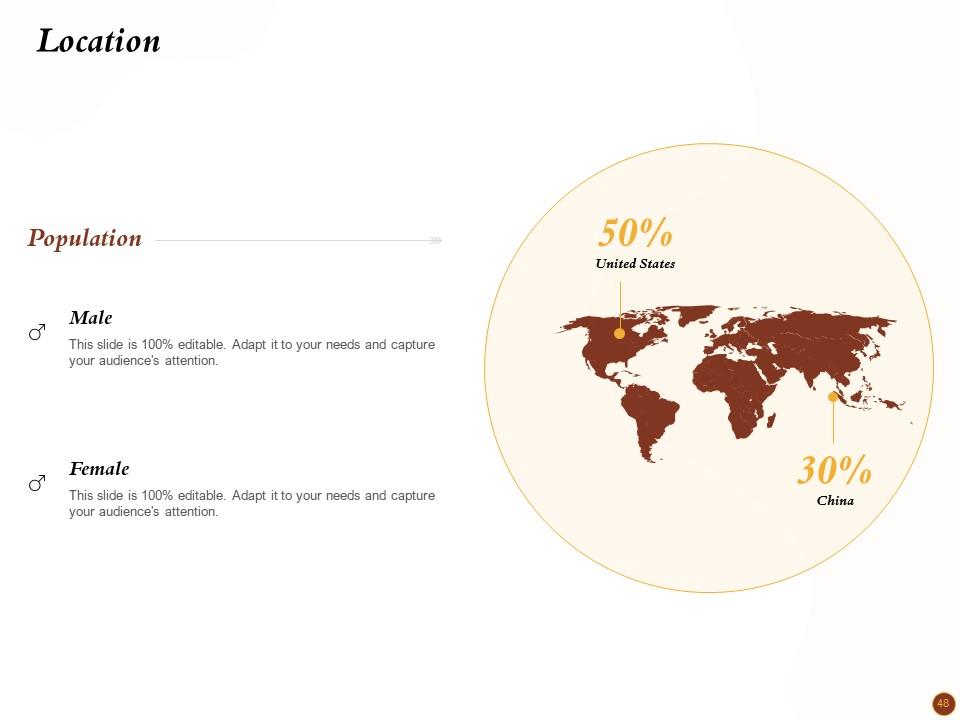
Slide 48: This slide depicts Location.
Slide 49: This slide shows Magnifying Glass for highlighting important content.
Slide 50: This is Lego slide.
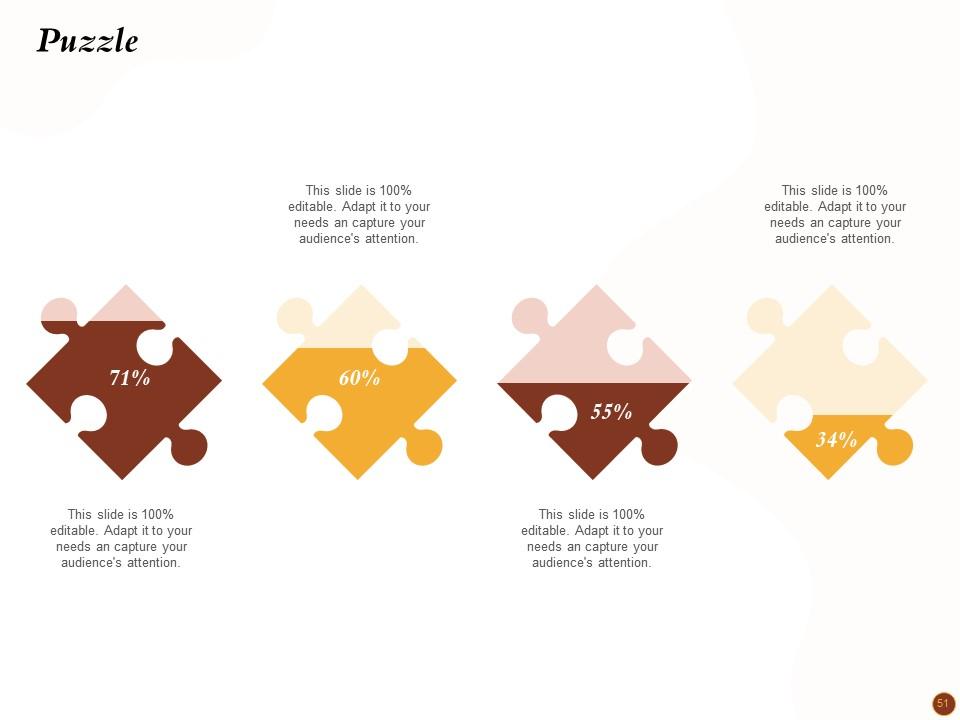
Slide 51: This slide displays Puzzle process.
Slide 52: This slide shows Timeline process.
Slide 53: This is Thank You slide with Contact details.
Distressed Debt Restructuring Powerpoint Presentation Slides with all 53 slides:
Use our Distressed Debt Restructuring Powerpoint Presentation Slides to effectively help you save your valuable time. They are readymade to fit into any presentation structure.
-
Excellent template with unique design.
-
Designs have enough space to add content.
-
Innovative and attractive designs.
-
Attractive design and informative presentation.
-
Enough space for editing and adding your own content.
-
Colors used are bright and distinctive.


