


Donut pie chart powerpoint shapes





Try Before you Buy Download Free Sample Product
 Impress Your
Audience
 100%
Editable
 Save Hours
of Time


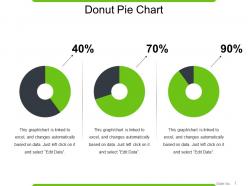
Introducing this Donut Pie Chart PowerPoint Shapes that will assist you depict the numeric data in a visually appealing manner. Present the different products your organization is dealing in and showcase the profit percentage of each product. The donut pie chart PPT template showcasing three different pie charts can also be employed for depicting the profits earned from different market segments. Illustrate various components of the products and services that your company is providing by incorporating this amazingly designed donut chart PowerPoint slide show. Display the market share, amount of customer acquisition, size of the market segment, with the assistance of this Pie chart PPT diagram. You can also present the numerical data and the mathematical calculations in front of your audience using this eye-catching donut pie chart PowerPoint slide design.
People who downloaded this PowerPoint presentation also viewed the following :
Donut pie chart powerpoint shapes with all 5 slides:
Eliminate hard feelings with our Donut Pie Chart Powerpoint Shapes. Benefit from a congenial environment.


FAQs for Donut pie
Traditional pie charts display data as a complete circle with segments radiating from the center, while donut pie charts feature a hollow center, creating a ring-like appearance that allows for additional information display. Donut charts enable organizations to showcase central metrics, legends, or summary data within the hollow space, ultimately delivering enhanced visual hierarchy and more efficient use of presentation real estate.
Donut pie charts are preferred when displaying hierarchical data relationships, emphasizing central metrics or KPIs, comparing multiple data series simultaneously, and reducing visual weight in dense dashboards. These charts enable cleaner presentation of complex datasets while maintaining focus on key performance indicators, with many organizations finding that the central space effectively highlights critical business metrics, ultimately delivering enhanced readability and strategic data communication.
Donut pie charts enhance readability by creating central space for key metrics, reducing visual clutter through cleaner segments, and enabling layered data representation with concentric rings. These design elements streamline complex financial reports, operational dashboards, and performance analytics, with many organizations finding that the central focal point delivers immediate context while maintaining proportional accuracy for strategic decision-making.
Common mistakes include overcrowding with too many segments, using similar colors that reduce readability, omitting clear labels or legends, creating segments too small to interpret, and failing to order data logically. These design flaws compromise data visualization effectiveness by confusing audiences, reducing analytical clarity, and undermining presentation impact, with many organizations finding that simplified, well-labeled donut charts deliver significantly better audience comprehension and decision-making outcomes.
Color in donut pie charts significantly influences audience comprehension by creating visual hierarchy, enabling quick pattern recognition, and facilitating data comparison across segments. Strategic color choices enhance accessibility through contrast, guide attention to key insights, and reduce cognitive load, with many organizations finding that consistent color coding across presentations streamlines decision-making processes and improves stakeholder engagement.
Best practices for labeling donut pie charts include using direct labels on larger segments, legends for smaller sections, clear percentage values, consistent color coding, and strategic placement to avoid overlap. These approaches enhance readability by minimizing visual clutter, ensuring accessibility across different audiences, and maintaining professional presentation standards, with many organizations finding that well-labeled donut charts significantly improve data comprehension and decision-making efficiency.
Donut pie charts can display hierarchical data through nested rings, with outer rings representing subcategories of inner ring segments, though this approach presents both visualization clarity challenges and interpretive opportunities. While effective for simple two-level hierarchies like regional sales broken down by product categories, many organizations find that dedicated hierarchical visualizations like treemaps or sunburst charts ultimately deliver better readability and deeper analytical insights.
Size variations in donut slices significantly impact data interpretation by creating visual emphasis that can mislead viewers, as larger slices appear more important regardless of actual values. These distortions affect decision-making in business presentations, financial reports, and marketing dashboards, with many organizations finding that maintaining proportional accuracy ensures stakeholders correctly assess performance metrics, budget allocations, and strategic priorities.
Animations can be integrated into donut pie charts through progressive segment reveals, rotating transitions, hover-triggered expansions, data-driven morphing effects, and sequential storytelling sequences. These dynamic elements enhance audience engagement by drawing attention to key insights, facilitating step-by-step data exploration, and creating memorable visual narratives, with many presenters finding that animated charts significantly improve comprehension and retention rates.
Excel, Tableau, Power BI, Google Charts, and Adobe Illustrator offer robust donut chart capabilities with customizable colors, labels, and interactive features. These tools streamline data visualization by enabling dynamic filtering, real-time updates, and professional formatting, with many organizations finding that combining spreadsheet data with specialized visualization software ultimately delivers more engaging presentations and clearer business insights.
Cultural color interpretations vary significantly, with red symbolizing luck in China but danger in Western contexts, while green represents prosperity in Islam but inexperience in finance. When designing donut pie charts for global audiences, organizations should research target demographics, use culturally neutral colors like blues and grays for sensitive data, and provide clear legends, ultimately ensuring accurate data interpretation and avoiding miscommunication across diverse markets.
Donut pie charts create psychological impacts through enhanced focus, reduced visual overwhelm, and improved data comprehension by eliminating the central focal point that traditional pie charts create. These shapes enable presenters to emphasize key metrics more effectively, reduce cognitive load for audiences, and foster better decision-making discussions, with many organizations finding that the cleaner visual approach enhances stakeholder engagement and presentation outcomes.
Statistical guidelines recommend limiting donut pie charts to 3-7 segments, with 5 being optimal for visual clarity and cognitive processing. Beyond seven segments, viewer comprehension decreases significantly, while fewer than three segments may not justify the donut format, with many data visualization professionals finding that strategic segment grouping and "other" categories help maintain clarity while delivering comprehensive insights.
Interactivity transforms donut pie charts by enabling hover effects for detailed data tooltips, click-through functionality to drill down into specific segments, and dynamic filtering that updates visualizations in real-time. These interactive features enhance audience engagement during digital presentations, allow presenters to respond dynamically to questions, and enable viewers to explore data independently, ultimately delivering more personalized insights and improved comprehension across complex datasets.
The central hole in a donut pie chart creates space for displaying key metrics, totals, or categorical labels, while maintaining the proportional relationships of the outer segments. This design enhancement enables presenters to maximize information density without cluttering, with many business analysts finding that the central space effectively highlights critical KPIs, summary statistics, or contextual data, ultimately delivering cleaner visualizations and improved audience comprehension.
-
Very unique and reliable designs.
-
The Designed Graphic are very professional and classic.