

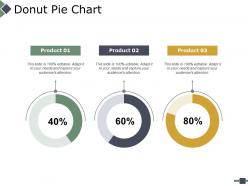
Donut pie chart ppt powerpoint presentation file infographics





Try Before you Buy Download Free Sample Product
 Impress Your
Audience
 100%
Editable
 Save Hours
of Time


Give them a gift of brilliance with our Donut Pie Chart Ppt Powerpoint Presentation File Infographics. Be honored as a donor.
People who downloaded this PowerPoint presentation also viewed the following :
Donut pie chart ppt powerpoint presentation file infographics with all 5 slides:
Identify the cause of interference with our Donut Pie Chart Ppt Powerpoint Presentation File Infographics. Address the factors generating disturbance.


FAQs for Donut pie chart ppt powerpoint
Donut pie charts offer enhanced readability through their central space for displaying key metrics, improved visual hierarchy by reducing clutter, and better comparison capabilities when showing multiple data series. These design elements streamline data presentation by enabling clearer labeling, accommodating additional context information, and facilitating dashboard integration, with many organizations finding that donut charts deliver more professional visual communication and enhanced audience comprehension.
Donut pie charts excel when displaying hierarchical data relationships, comparing parts to whole with multiple categories, showcasing brand elements in the center space, and presenting financial breakdowns or market share analysis. These visualizations prove particularly effective in executive dashboards, marketing reports, and budget presentations, with many organizations finding that the central space enhances storytelling while maintaining clear proportional comparisons for strategic decision-making.
Color choices in donut pie charts significantly impact audience perception by creating visual hierarchy, emotional responses, and comprehension patterns through strategic contrast, saturation, and psychological associations. Well-designed color schemes enhance data interpretation by guiding attention to key segments, reducing cognitive load, and ensuring accessibility, with many organizations finding that thoughtful color selection ultimately delivers clearer insights and more persuasive presentations.
Best practices for labeling donut pie chart sections include using direct labels placed outside the chart with leader lines, maintaining consistent font sizes and colors, positioning labels to avoid overlaps, and using percentage values alongside descriptive text. These approaches enhance readability by creating clear visual connections between data and labels, ensuring accessibility across different viewing contexts, and enabling audiences to quickly interpret segment relationships, ultimately delivering more effective data communication and improved decision-making capabilities.
Donut pie charts represent complex data by utilizing the central space for key metrics or summaries while maintaining visual clarity through strategic color coding and hierarchical grouping. This approach enables financial analysts to display portfolio allocations alongside performance indicators, or healthcare organizations to show patient demographics with outcome metrics, ultimately delivering comprehensive insights without cognitive overload while enhancing decision-making efficiency.
Popular software tools for creating visually appealing donut pie charts include Tableau, Power BI, Excel, Google Charts, D3.js, and specialized platforms like Canva or Adobe Illustrator. These tools enhance data visualization by offering customizable color schemes, interactive features, and professional formatting options, with many organizations finding that advanced platforms like Tableau and Power BI deliver superior interactivity and seamless integration capabilities.
The donut pie chart's hollow center creates a natural focal point that draws viewers' attention inward, while the ring shape allows for better comparison of segment proportions and reduces visual distortion common in traditional pie charts. This design enhances data comprehension by enabling cleaner labeling, supporting additional contextual information in the center space, and delivering more balanced visual weight distribution, with many analysts finding that audiences process segmented data more accurately and retain key insights longer.
**INPUT**: What type of data distribution is best suited for a donut pie chart? **OUTPUT**: Donut pie charts work best with categorical data that shows parts of a whole, ideally with 3-7 distinct segments representing clear proportions or percentages. These visualizations excel when displaying market share breakdowns, budget allocations, survey responses, or demographic distributions, with many organizations finding that fewer segments enhance readability and strategic decision-making across presentations. [Word count: 54 words]
Interactivity can be incorporated through hover effects revealing detailed data, clickable segments for drill-down analysis, animated transitions between datasets, and dynamic filtering options. These interactive features enhance audience engagement by transforming static presentations into immersive experiences, with many organizations finding that interactive donut charts increase comprehension rates and facilitate more productive data-driven discussions.
Common mistakes include overcrowding with too many segments, using similar colors that blend together, omitting clear labels and data values, creating segments too small to read, and failing to order data logically. These design errors undermine data comprehension by making charts confusing, visually cluttered, and difficult to interpret, with many presenters finding that simplified, well-labeled donut charts deliver significantly better audience engagement and understanding.
The donut hole size significantly impacts visual balance and data interpretation, with larger holes creating modern, minimalist aesthetics while smaller holes emphasize data prominence and detailed comparisons. Through strategic hole sizing, designers enhance readability by optimizing label placement, reducing visual clutter, and directing focus to key segments, with many organizations finding that medium-sized holes deliver optimal clarity and professional appeal.
Donut pie charts aren't ideal for showing temporal changes since they display static proportions at single time points, but they can effectively demonstrate change through strategic combinations like side-by-side comparisons, animated transitions, or integrated dashboards. Many organizations enhance these charts with trend indicators, percentage change annotations, and complementary line graphs, ultimately delivering clearer insights into evolving data patterns while maintaining the visual appeal of proportional relationships.
The legend serves as a crucial reference guide that identifies what each colored segment represents in the donut pie chart, enabling viewers to accurately interpret data categories and their proportional relationships. Without a clear legend, stakeholders across industries like retail analytics, financial reporting, and market research would struggle to extract meaningful insights, ultimately compromising data-driven decision making and strategic planning effectiveness.
Animations enhance donut pie chart comprehension by revealing data progressively through sequential segment builds, rotating emphasis highlights, and smooth transitions between different data views. These dynamic elements help audiences process complex information more effectively, with presenters finding that animated reveals, hover effects, and storytelling sequences significantly improve data retention and engagement during business presentations.
Creative combinations include layering donut charts with bar charts for categorical breakdowns, integrating timeline elements for temporal data, embedding mini charts within segments for drill-down analysis, and pairing with geographic maps for location-based insights. These hybrid approaches enhance data storytelling by providing multiple analytical perspectives simultaneously, with many organizations finding that combining visualization techniques delivers more comprehensive dashboards and ultimately enables stakeholders to identify patterns and relationships that single-chart presentations might miss.
No Reviews