

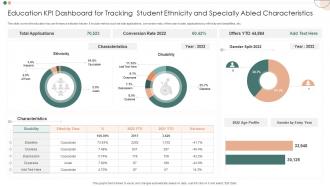
Education KPI Dashboard For Tracking Student Ethnicity And Specially Abled Characteristics





Try Before you Buy Download Free Sample Product
 Impress Your
Audience
 100%
Editable
 Save Hours
of Time


This slide covers the education key performance indicator tracker. It include metrics such as total applications, conversion rate, offers year to date, applications by ethnicity and disabilities, etc.
People who downloaded this PowerPoint presentation also viewed the following :
Education KPI Dashboard For Tracking Student Ethnicity And Specially Abled Characteristics with all 7 slides:
Use our Education KPI Dashboard For Tracking Student Ethnicity And Specially Abled Characteristics to effectively help you save your valuable time. They are readymade to fit into any presentation structure.






FAQs for Education KPI Dashboard For Tracking Student Ethnicity And
Look, assessment scores are solid but don't get trapped thinking that's everything. Track skill progression over time - way more telling than a single test. Knowledge retention rates matter too, especially if you check back weeks later. Honestly? Student self-reflection surveys tell you stuff standardized scores never will. Real-world application demos are gold. Oh, and peer collaboration metrics if you can swing it - shows actual teamwork skills developing. Mix your quantitative data with qualitative feedback though. Pick maybe 3-4 KPIs that actually match what you're trying to teach. Don't go crazy tracking everything or you'll drown in data.
Look, the data's pretty clear - kids who show up regularly just do better on tests and actually graduate. Track your attendance percentages first, then flag anyone missing 10% or more of school days (that's your chronic absenteeism marker). The correlation between showing up and GPA is honestly kind of obvious when you think about it. You'll want to break this down by different student groups too - sometimes you'll spot patterns that reveal bigger equity problems. Start with your baseline numbers, watch the monthly trends, and catch those chronic cases early before they spiral. Simple but effective.
Teacher efficacy is basically how confident your teachers feel about actually making a difference with students. Confident teachers? Better test scores, higher graduation rates, more engaged kids. It's this weird self-fulfilling prophecy - when teachers believe they can help struggling students, they actually do. They'll stick with interventions longer instead of giving up. Honestly, I think it's one of those metrics people sleep on. Research backs this up too - there's a direct link between teacher confidence and student outcomes. You should run some teacher surveys alongside your achievement data and see how they connect.
So for tracking tech integration, I'd start with device-to-student ratios and how much your teachers are actually adopting the digital tools. Student engagement scores are key too - compare tech lessons vs traditional ones. Digital literacy assessments honestly shocked me with what they revealed about our gaps. Track daily usage of stuff like interactive whiteboards and learning management systems. Oh, and don't just measure if you have the tech sitting there - frequency matters way more than availability. The real win is measuring both usage AND educational impact together.
Start with completion rates and how much time students actually spend logged in - that's your bread and butter. Assessment scores vs in-person classes matter too. I'd also check retention rates and satisfaction surveys, honestly those tell you more than you'd think. Time-to-completion is weird though - some kids race through everything while others just... disappear for weeks. Oh, and tech problems will mess up your data big time, so try to separate real engagement issues from WiFi disasters. Build from those basics first, then get fancy with other metrics once you see what's actually happening.
Honestly, regular surveys are your best bet here. Hit up students, parents, teachers, employers - maybe quarterly or annually. Yeah, I know surveys are annoying but the feedback's actually gold. Track stuff like Net Promoter Scores and satisfaction ratings for different services. Parents worry about totally different things than employers, so you'll want to separate those responses when analyzing. Oh, and here's the key part - actually do something with what people tell you. Otherwise they'll just ignore your next survey and you're back to square one with no data.
Look at your data by breaking it down by race, income, language status - don't just look at school-wide averages because gaps disappear that way. Track the basics like test scores and graduation rates, but honestly the early stuff matters more. Attendance patterns, reading levels in elementary - that's where you catch problems before they blow up. Pick maybe 2-3 metrics that actually matter to your district and set real targets for the groups falling behind. Monthly check-ins work better than waiting for year-end results. Build dashboards that alert you when things start sliding backwards.
Honestly, graduation rates are like your best reality check for whether you're actually helping students succeed. They tell you if people are finishing what they started, not just showing up. When rates are high, your support systems and programs are probably doing their job. Low rates though? Something's broken - could be retention problems, crappy support, or curriculum issues. Accreditors and funders care about these numbers too, obviously. I'd definitely look at overall rates but also break them down by different student groups to catch any equity problems. Oh, and compare yourself to similar schools first so you know if you're even in the ballpark.
Think of cost per student as your reality check for how efficiently you're running things. You want to track it with actual results - graduation rates, test scores, that stuff. But here's the thing: cheaper isn't automatically better. Sometimes you need to spend more to get better outcomes, which honestly makes sense when you think about it. Compare your numbers to similar schools over time. That'll show you where you might be wasting money or where throwing a bit more cash could actually help kids succeed. It's about finding the right balance.
Honestly, you're gonna want to hit the basics first - employment rates 6-12 months after graduation, then salary bumps over like 3-5 years. Track promotions too. Alumni surveys are clutch for getting real feedback! I'd also look at who's going back for more education or getting certifications. Awards and industry recognition matter. Oh, and don't sleep on the networking stuff - see how many come back for events or mentor students. That's actually pretty telling about program quality. Set up surveys at 1, 3, and 5 years so you're not scrambling for data later.
Honestly, tracking engagement is way easier when you break it down by group. Students? Look at attendance, whether they're actually finishing assignments, jumping into discussions, and how much time they spend on your platform. Teachers are different - track their professional development stuff, how often they collaborate, and what students say about them. The real trick is avoiding those meaningless "busy work" numbers that don't tell you anything useful. Pick maybe 2-3 solid metrics per group first, see what your baseline looks like, then use that to figure out who's struggling and what's genuinely working. You can always add more later once you get the hang of it.
Set up monthly or quarterly reviews to look at performance trends, completion rates, and assessment scores. Get feedback from students and instructors too - they're living this stuff daily. Just keep surveys short because survey fatigue is absolutely real. I'd cross-reference your data with industry benchmarks to catch blind spots. Honestly, small tweaks work way better than massive changes. Pick 2-3 key metrics to track first instead of trying to measure everything at once.
So here's the thing - when parents actually show up and communities get involved, test scores go up. Attendance improves. Kids graduate more. It's pretty straightforward but the data really proves it across all kinds of schools. Having parents help with homework and join school stuff creates better learning at home. Community partnerships bring extra resources and mentors too. I know it sounds super obvious, but honestly it's one of the biggest factors. If you're looking at metrics, definitely track parent participation rates alongside the usual stuff - they're like early warning signs for how students will do.
Okay so education KPIs are tricky - test scores and graduation rates look good on paper but they're missing huge pieces. Like, what about creativity or how engaged kids actually are? That stuff matters too but never shows up in data. Also your numbers get weird when you don't account for socioeconomic differences between schools. Honestly, comparing a wealthy district to an underfunded one without context is pretty useless. Education benefits take forever to show up anyway, but KPIs want quick results. Use multiple metrics together and don't forget the bigger picture behind those numbers.
Honestly, charts and graphs are total game-changers for education data. Raw spreadsheets make everyone's eyes glaze over - I've seen it happen in too many meetings. With dashboards showing student performance trends or attendance patterns, teachers and administrators can actually spot what's working (and what isn't). Bar charts work great for budget stuff too, which is weirdly satisfying to look at. Instead of drowning people in numbers, you're giving them something they can understand in seconds. Your next presentation will be so much clearer. Start simple with your biggest metrics first.
-
Use of different colors is good. It's simple and attractive.
-
Unique research projects to present in meeting.