

Empathy map s103 customer retention and engagement planning ppt gallery maker




Try Before you Buy Download Free Sample Product
 Impress Your
 Audience
 100%
100% Editable
 Save Hours
 of Time


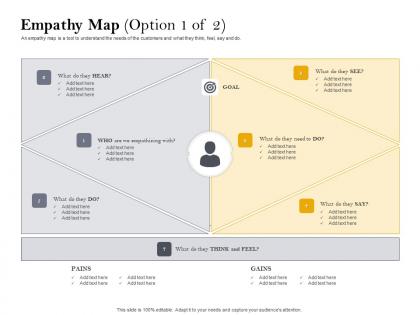
An empathy map is a tool to understand the needs of the customers and what they think, feel, say and do.
People who downloaded this PowerPoint presentation also viewed the following :
Empathy map s103 customer retention and engagement planning ppt gallery maker with all 2 slides:
Use our Empathy Map S103 Customer Retention And Engagement Planning Ppt Gallery Maker to effectively help you save your valuable time. They are readymade to fit into any presentation structure.
FAQs for Empathy map s103 customer retention and engagement planning
Empathy maps include four key components: what users say, think, feel, and do, providing comprehensive insights into audience motivations, pain points, and behaviors. These components work together by revealing gaps between expressed opinions and internal thoughts, uncovering emotional drivers behind decisions, and identifying actionable patterns, with many marketing teams finding that this holistic approach delivers more targeted campaigns and enhanced customer experiences.
Empathy maps enhance the design thinking process by capturing user emotions, thoughts, actions, and pain points during the "empathize" phase, providing deeper customer insights that inform ideation and prototyping. By visualizing what users say, think, feel, and do, design teams create more user-centered solutions, streamline decision-making around feature prioritization, and ultimately deliver products that resonate authentically with target audiences' actual needs.
Empathy maps reveal user pain points by systematically capturing what users think, feel, see, hear, say, and do throughout their journey, highlighting friction areas and emotional stress points. This comprehensive visualization enables teams to identify specific frustrations, unmet needs, and behavioral barriers across different touchpoints, with many product teams finding that these insights directly inform feature prioritization and user experience improvements.
Teams can collaboratively create effective empathy maps by gathering diverse perspectives through cross-functional workshops, conducting user interviews together, and synthesizing insights through structured brainstorming sessions. This collaborative approach enables marketing, design, and product teams to develop comprehensive customer understanding, align on user needs, and create more targeted solutions, ultimately delivering enhanced customer experiences and strategic market positioning.
Common pitfalls when developing empathy maps include making assumptions without user research, creating generic personas instead of specific user profiles, focusing solely on positive feedback while ignoring pain points, and developing maps in isolation rather than with cross-functional teams. These mistakes undermine customer understanding, with many organizations finding that collaborative, research-backed empathy mapping delivers more accurate insights and better product outcomes.
Visual representation in empathy maps enhances team understanding by transforming abstract user insights into concrete, shared reference points that facilitate collaborative discussion and alignment. Through organized visual sections covering thoughts, feelings, actions, and pain points, teams can quickly identify patterns, prioritize user needs, and develop more targeted solutions, with many product development teams finding that visual empathy maps significantly improve cross-functional communication and user-centered decision making.
Empathy maps integrate seamlessly with user interviews, surveys, personas, journey mapping, and usability testing by serving as a synthesis tool that consolidates insights from multiple research streams. Through this strategic combination, organizations enhance user understanding, streamline product development decisions, and create more targeted customer experiences, with many design teams finding that empathy maps help bridge quantitative data with qualitative insights for comprehensive user-centered strategies.
Empathy maps should be updated every 3-6 months or when significant market shifts occur, customer feedback changes, or new product features launch. Regular updates ensure organizations maintain accurate customer insights, with many companies finding that quarterly reviews during strategic planning cycles help teams stay aligned with evolving customer needs and competitive landscapes.
Empathy enhances customer experiences by enabling deeper understanding of customer emotions, needs, and pain points throughout their journey. Through empathy mapping, businesses systematically capture what customers think, feel, see, and do, allowing organizations to design more intuitive services, reduce friction points, and create meaningful interactions that ultimately deliver stronger loyalty and competitive advantage.
Empathy maps refine marketing strategies by revealing customer emotions, pain points, motivations, and decision-making triggers, enabling more targeted messaging and positioning. Through deeper audience insights, marketing teams create campaigns that resonate authentically with customer needs, ultimately delivering higher engagement rates, improved conversion metrics, and stronger brand connections across diverse market segments.
Tools for creating effective empathy maps include Miro, Mural, Figma, XMind, and Adobe XD, along with traditional whiteboarding applications. These platforms streamline collaborative mapping by enabling real-time editing, template libraries, and seamless integration with research data, with many design teams finding that digital tools enhance cross-functional participation and ultimately deliver more comprehensive user insights.
Understanding user emotions through empathy mapping benefits product design by revealing unmet needs, identifying pain points, and uncovering emotional triggers that drive user behavior. This deeper insight enables designers to create more intuitive interfaces, develop features that truly resonate with users, and ultimately deliver products with higher adoption rates and customer satisfaction, giving companies a significant competitive advantage in today's user-centric market.
Empathy maps find applications across healthcare for patient experience design, retail for customer journey optimization, financial services for user-friendly app development, education for student engagement strategies, and technology for product interface improvements. These tools enable organizations to streamline service delivery, enhance customer satisfaction, and minimize miscommunication, with many companies finding that empathy-driven insights ultimately deliver competitive advantage and stronger market positioning.
Empathy mapping facilitates better cross-functional communication by creating shared understanding of user perspectives, aligning diverse team viewpoints around common customer insights, and establishing a unified language for discussing user needs. Through collaborative mapping sessions, teams from marketing, development, design, and operations can bridge departmental silos, reduce miscommunication, and ultimately deliver more cohesive, user-centered solutions.
Empathy map effectiveness can be measured through user engagement rates, task completion improvements, customer satisfaction scores, conversion rate increases, and reduced support tickets. These metrics demonstrate how well teams translate user insights into actionable solutions, with many organizations finding that successful empathy mapping correlates directly with enhanced product adoption and stronger customer retention rates.
-
Thanks for all your great templates they have saved me lots of time and accelerate my presentations. Great product, keep them up!
-
Great quality slides in rapid time.