

Employee Communication And Engagement Dashboard With Suggestions And Response Rate





Try Before you Buy Download Free Sample Product
 Impress Your
Audience
 100%
Editable
 Save Hours
of Time


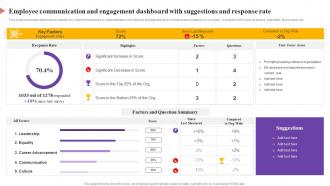
This slide showcases dashboard to identify key improvement areas in implementation of employee engagement and communication initiatives by company. It includes KPIs such as factors, highlights, focus areas, etc.
People who downloaded this PowerPoint presentation also viewed the following :
Employee Communication And Engagement Dashboard With Suggestions And Response Rate with all 7 slides:
Use our Employee Communication And Engagement Dashboard With Suggestions And Response Rate to effectively help you save your valuable time. They are readymade to fit into any presentation structure.






FAQs for Employee Communication And Engagement Dashboard With Suggestions
You gotta look at both hard numbers and the softer stuff. Start with turnover rates, engagement survey scores, and how often people call in sick. Internal promotions are huge too - shows if people actually grow there. Pulse surveys and eNPS give you the real tea on what employees think. Also track who's showing up to company events or training - tells you a lot about buy-in. Exit interviews can be brutal but they're honestly the most valuable feedback you'll get. Oh, and definitely break things down by manager since bad bosses are usually why people quit. I'd say pick maybe 6 metrics max so you don't drown in spreadsheets.
Honestly, real-time dashboards are a game changer - you can actually see what's happening with engagement instead of waiting forever for those quarterly reports. When teams start struggling, you'll catch it right away. Same with participation dips or survey response drops. Way easier than drowning in spreadsheets (ugh, been there). The visual stuff makes complex data actually digestible at a glance. You can pivot your approach super quickly when something's not working. Oh, and definitely set up alerts for your key metrics - trust me, you don't want to be caught off guard when engagement tanks.
Honestly, you've gotta start with what your employees actually want to see. Survey them first - ask what engagement means to them, not what the executives think matters. I've watched so many companies build these gorgeous dashboards that track totally useless stuff. Your team knows what barriers they're hitting and how they'd measure progress. Focus groups are your friend here, trust me. Build around their insights instead of guessing. Short sentences work better than cramming everything together. Make the visuals show what people genuinely care about, and you'll actually get somewhere with this thing.
Monthly or quarterly updates work best for engagement dashboards. Don't go more frequent than that - employee engagement moves slowly, and weekly tracking just creates fake panic. I've watched teams stress over daily numbers that literally don't matter. You'll get enough data points monthly to see real patterns without drowning your team in metrics. Quarterly's solid too, especially if you're doing seasonal surveys. Just pick something and be consistent about it. Way better to focus on the bigger trends instead of freaking out every time a number dips.
Skip the data dump approach - pick your top 5-7 metrics that actually matter to leadership. Break everything down by department and role so managers can pinpoint real issues instead of guessing. Trend lines are your friend here, honestly executives eat that stuff up when they see improvement over time. Color coding works great for flagging problem areas vs wins. Oh, and set up alerts when scores tank below certain levels. That way you're not scrambling during quarterly reviews wondering why nobody saw the red flags coming. Way better than just throwing numbers on a screen and calling it done.
First thing - filter by your team and look for patterns in engagement scores or repeated survey issues. That trend view feature is honestly amazing for spotting this stuff. Next, dig into the actual comments to figure out what's really going on behind those numbers. Use what you find to have real conversations with your people in one-on-ones. I know it sounds obvious, but you'd be surprised how many managers skip that step. Then build action plans based on what the data's actually showing you. The whole point is making those dashboard numbers mean something in real life.
Power BI's probably your safest choice, especially if you're already using Microsoft stuff - everything just clicks together better. Tableau works too but honestly it's overkill for most HR dashboards. You'll need to hook into your HRIS (Workday, BambooHR, whatever you've got) plus any survey platforms. Culture Amp and Glint are solid for pulse surveys. Just make sure whatever you pick actually integrates with your current systems. I learned this the hard way at my last job - spent weeks fighting with APIs that barely worked. Short surveys get way better response rates too.
So basically, these dashboards track your engagement stuff over weeks and months, which is actually pretty useful for catching patterns early. Like if you notice seasonal dips or things gradually getting worse before they blow up. Plus you can see if that new manager you hired is actually making teams happier, or whether your latest policy changes are doing anything. Way easier than digging through old spreadsheets from forever ago - the visual charts make trends super obvious. Honestly, just set up monthly automated reports so you're always keeping tabs on things and can adjust when you spot red flags.
Start with role-based access - managers only see their team's stuff, HR gets the bigger picture. Multi-factor authentication is clutch here, plus encrypt everything in transit. Audit logs are super helpful too so you can see who looked at what and when. Oh, and try anonymizing the sensitive metrics when you can - engagement scores don't always need names attached. The technical side gets messy quick but honestly these basics will handle most of your security headaches from day one.
Yeah totally! Just set up different views for each team based on what they actually care about. HR probably wants retention rates and satisfaction stuff, while sales will be all about performance metrics. Meet with the department heads first though - they'll tell you exactly what's bugging them. Then you can customize the filters and visuals for each group. The permission settings are handy too since you can control who sees what. Honestly, most people don't realize how flexible these dashboards can be. Start simple and build from there.
Honestly, people won't use it if it feels like homework. Show real wins right away - team achievements, milestones, feedback that actually changed something. Single sign-on is clutch here, nobody's got time for multiple logins. Send weekly emails with the good stuff so they see value without logging in constantly. Progress bars work great, maybe some friendly team comparisons, but don't get crazy with gamification. Oh, and this is huge - your managers need to actually pull dashboard data in meetings. If leadership ignores it, everyone else will too.
Honestly, bar charts are your best friend for this stuff - way better than drowning people in spreadsheets nobody reads anyway. I'd do engagement scores by department, maybe some trend lines so you can see if things are getting worse or better. Heat maps are pretty cool for spotting trouble spots fast. Traffic light colors work really well too. Green means you're good, red means fix this now. Don't overthink it though - start with like 3 main visuals that actually tell the story. Managers should be able to look at it for two seconds and get what's going on. You can always jazz it up later.
So predictive analytics basically turns your dashboard into a crystal ball - you can spot flight risks before they even start polishing up their resumes. Pretty cool stuff. It analyzes survey data, performance numbers, behavioral patterns, all that jazz to predict who might quit and when teams are heading for trouble. Instead of scrambling after people leave, you actually get early warnings. The system can even tell you the best timing for retention moves. Honestly, it's way better than playing catch-up when your top performers are already halfway out the door.
Honestly, skip the boring feature demos. Do hands-on workshops with real dashboard scenarios instead. Walk them through translating metrics into actual actions - like "engagement drops in Q2? Here's what to ask in your next 1:1." The numbers are useless if they can't connect them to team stuff. Teach pattern recognition, not just reading individual data points. Oh, and make simple decision trees they can reference later - trust me on this one. Follow up after they've actually used it for a while. Give them a cheat sheet with red flags too.
Microsoft's doing this really well with their daily pulse surveys that feed into live dashboards. Google has "gThanks" which mixes recognition with engagement data - honestly pretty clever. Then there's Salesforce with their V2MOM thing that connects employee goals to engagement scores directly. Adobe ditched annual reviews completely for real-time "Check-In" dashboards that give managers instant feedback. The pattern I'm seeing? Everyone's moved away from those painful quarterly surveys to actual real-time tracking. My advice would be pick one metric first and just build from there - don't try to boil the ocean right away.
-
The quality of PowerPoint templates I found here is unique and unbeatable. Keep up the good work and continue providing us with the best slides!
-
Spacious slides, just right to include text. SlideTeam has also helped us focus on the most important points that need to be highlighted for our clients.