

Employee Demographics And Gender Distribution Dashboard




Try Before you Buy Download Free Sample Product
 Impress Your
 Audience
 100%
100% Editable
 Save Hours
 of Time


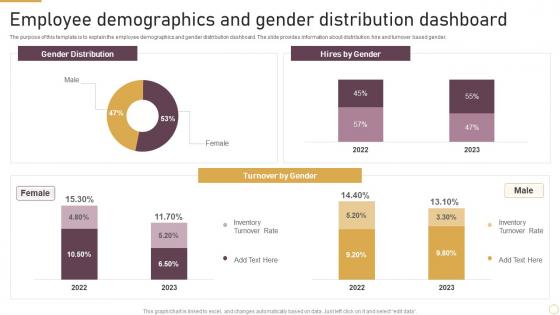
The purpose of this template is to explain the employee demographics and gender distribution dashboard. The slide provides information about distribution, hire and turnover based gender.
People who downloaded this PowerPoint presentation also viewed the following :
Employee Demographics And Gender Distribution Dashboard with all 7 slides:
Use our Employee Demographics And Gender Distribution Dashboard to effectively help you save your valuable time. They are readymade to fit into any presentation structure.





FAQs for Employee Demographics And
An Employee Demographics Dashboard should include age distribution, gender representation, ethnic diversity, educational backgrounds, tenure lengths, department distributions, geographic locations, and hiring trends. These metrics enable organizations to identify diversity gaps, plan succession strategies, and ensure equitable representation across all levels, with many companies finding that comprehensive demographic insights ultimately drive better talent management decisions and foster more inclusive workplace cultures.
Companies leverage demographic data by identifying representation gaps, tracking recruitment patterns, measuring promotion rates across groups, and assessing pay equity through comprehensive analytics. This strategic approach enables organizations to set targeted diversity goals, implement evidence-based inclusion programs, and monitor progress over time, with many finding that data-driven initiatives deliver measurably improved workplace equity and enhanced organizational performance.
**INPUT**: What tools or software are best for creating an interactive Employee Demographics Dashboard? **OUTPUT**: Leading tools for interactive employee demographics dashboards include Tableau, Power BI, Qlik Sense, Google Data Studio, and specialized HR platforms like BambooHR or Workday Analytics. These solutions streamline workforce analysis by enabling real-time filtering, drill-down capabilities, and automated reporting, with many organizations finding that interactive dashboards enhance strategic workforce planning and improve diversity tracking across departments.
Employee demographics significantly influence organizational culture by shaping communication styles, work preferences, values, and collaboration approaches across different generational, cultural, and professional backgrounds. These demographic variations create opportunities for enhanced innovation, diverse perspectives, and inclusive practices, while also presenting challenges in aligning engagement strategies, with many organizations finding that tailored approaches to different demographic segments ultimately deliver stronger workplace cohesion and performance.
Privacy considerations include data anonymization, role-based access controls, consent management, compliance with regulations like GDPR, and secure data transmission protocols. Organizations must balance transparency with confidentiality by implementing granular permissions, removing personally identifiable information, and ensuring demographic insights support strategic workforce planning while protecting individual employee privacy and maintaining regulatory compliance.
Demographic trends enable strategic workforce planning by revealing skills gaps, succession needs, retirement patterns, and diversity opportunities across departments and levels. Organizations leverage this data to proactively recruit emerging talent, develop targeted retention programs, and create succession pipelines, with many companies finding that data-driven talent strategies significantly reduce hiring costs while enhancing competitive positioning.
Employee demographics provide crucial insights into retention patterns by revealing which groups experience higher turnover rates, identifying potential bias in hiring or promotion practices, and highlighting departments or roles with concerning attrition trends. This data enables organizations to develop targeted retention strategies, address workplace equity issues, and implement proactive interventions, ultimately reducing costly turnover and improving overall workforce stability.
Demographic data should be updated monthly or quarterly to maintain accuracy, depending on organizational size and turnover rates, with real-time integration from HR systems enabling automatic updates for key metrics like headcount and departmental changes. Many organizations find that quarterly comprehensive reviews combined with monthly automated updates deliver optimal accuracy while minimizing administrative burden, ultimately ensuring leadership decisions are based on current workforce insights.
**INPUT**: What visual design elements are most effective for presenting demographic information? **OUTPUT**: Effective demographic visualizations include pie charts for composition breakdowns, bar charts for comparative analysis, heat maps for geographic distribution, and interactive filters for detailed exploration. These design elements enhance data comprehension by enabling quick pattern recognition, facilitating cross-departmental comparisons, and delivering actionable insights, with many organizations finding that clean, color-coded dashboards significantly improve strategic workforce planning and decision-making efficiency. [Word count: 60 words]
Organizations can use demographic insights to customize training approaches by analyzing age, experience levels, educational backgrounds, skill gaps, and learning preferences across different employee segments. Through targeted program design, companies enhance engagement rates, improve knowledge retention, and accelerate career development pathways, with many finding that personalized training strategies significantly boost employee satisfaction and organizational performance.
Organizations should be aware of biases including sampling bias from incomplete data collection, confirmation bias when seeking specific outcomes, correlation versus causation errors, and historical bias in existing datasets. These biases can lead to misguided decisions about hiring, promotions, and resource allocation, with many companies finding that regular bias audits and diverse analytical teams help ensure more accurate interpretations and equitable outcomes.
Employee demographics significantly influence leadership approaches by requiring adaptive communication strategies, culturally sensitive management practices, flexible work arrangements, and generational awareness to effectively engage diverse teams. Companies with varied demographics often find that successful leaders adapt their styles to accommodate different cultural backgrounds, age groups, and work preferences, ultimately delivering improved employee satisfaction, enhanced collaboration, and stronger organizational performance across all demographic segments.
Common challenges include data privacy compliance, incomplete or inaccurate employee self-reporting, inconsistent data collection methods across departments, and resistance from employees concerned about discrimination. These obstacles can compromise analytical accuracy and organizational insights, with many HR teams finding that establishing clear data governance policies, anonymous collection options, and transparent communication about data usage ultimately enhances participation rates and data quality.
Employee feedback integration enhances demographic trend interpretation by combining quantitative data with qualitative insights, sentiment analysis, and contextual understanding of workforce experiences. Through pulse surveys, focus groups, and feedback platforms, organizations can identify underlying factors driving demographic patterns, such as retention challenges or engagement variations across different groups, ultimately delivering more strategic workforce decisions and targeted interventions.
**INPUT**: What strategies can be employed to ensure demographic data is representative of the entire workforce? **OUTPUT**: Effective strategies include comprehensive data collection across all departments, anonymous survey mechanisms, regular audit cycles, mandatory participation policies, and multi-channel feedback systems. These approaches streamline representation by capturing diverse employee segments, minimizing response bias, and ensuring continuous data accuracy, with many organizations finding that strategic combination of voluntary and structured collection ultimately delivers complete workforce visibility and enhanced decision-making capabilities. **Word count: 60 words**
-
This visual representation is stunning and easy to understand. I like how organized it is and informative it is.
-
I was really impressed with the presentation I created with their templates. I’ll be using their services moving forward.