


Employee Happiness Survey Summary Report Survey SS





Try Before you Buy Download Free Sample Product
 Impress Your
Audience
 100%
Editable
 Save Hours
of Time


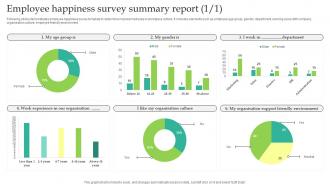
Following slides demonstrates employee happiness survey template to determine improvement area in workplace culture. It includes elements such as employee age group, gender, department, working years with company, organisation culture, employee friendly environment.
People who downloaded this PowerPoint presentation also viewed the following :
Employee Happiness Survey Summary Report Survey SS with all 8 slides:
Use our Employee Happiness Survey Summary Report Survey SS to effectively help you save your valuable time. They are readymade to fit into any presentation structure.







FAQs for Employee Happiness Survey Summary
Key indicators of employee happiness include job satisfaction scores, engagement levels, retention rates, work-life balance metrics, and feedback frequency through surveys and one-on-one meetings. These measurements help organizations identify strengths and improvement areas by tracking productivity trends, absenteeism patterns, and career development participation, ultimately enabling leadership to enhance workplace culture and competitive advantage.
**INPUT**: How frequently should we conduct employee happiness surveys for optimal feedback? **OUTPUT**: Optimal employee happiness surveys should be conducted quarterly, with pulse surveys monthly or bi-weekly to capture real-time sentiment changes, seasonal variations, and project-specific feedback cycles. This strategic combination enables organizations to identify trends early, address concerns proactively, and maintain continuous dialogue, with many companies finding that regular touchpoints significantly improve response rates and employee engagement outcomes. [Word count: 60 words]
Open-ended questions about specific experiences, anonymized rating scales on management effectiveness, and scenario-based queries about workplace challenges typically elicit the most honest responses. Questions focusing on career development opportunities, work-life balance concerns, and team dynamics generate insightful feedback, with many organizations finding that combining quantitative ratings with qualitative storytelling delivers comprehensive insights into employee satisfaction and engagement drivers.
Ensuring anonymity requires using third-party survey platforms, removing identifying questions, implementing anonymous submission systems, and clearly communicating confidentiality policies to employees. These approaches encourage honest feedback by eliminating fear of retaliation, with many organizations finding that anonymous surveys yield significantly higher response rates and more accurate insights into workplace satisfaction, ultimately enabling more effective retention strategies.
Company culture significantly influences employee happiness through shared values, work environment, leadership styles, communication practices, and recognition systems. These elements can be measured through culture-specific survey questions about psychological safety, inclusion, trust in leadership, and alignment with company values, with many organizations finding that strong cultural alignment directly correlates with higher engagement and retention rates.
Effective survey data analysis involves segmenting responses by demographics, departments, and tenure levels, identifying key patterns through statistical analysis, and comparing results against industry benchmarks and previous surveys. Organizations like tech companies and healthcare institutions find that combining quantitative metrics with qualitative feedback themes reveals actionable insights, ultimately enabling targeted interventions that enhance workplace satisfaction and employee retention.
Customer service, HR, sales, IT, and management teams typically require targeted questions in happiness surveys, as each faces unique challenges and stressors. These departments benefit from customized inquiries addressing specific pain points, such as customer interaction stress for service teams or workload management for IT, ultimately delivering more actionable insights and targeted improvement strategies.
External factors significantly influence employee happiness through job security concerns, wage pressures, market uncertainty, and organizational restructuring decisions. During economic downturns, companies often face budget constraints and layoffs, while economic growth periods typically enable better compensation packages, career advancement opportunities, and workplace investments, with many organizations finding that proactive communication about external challenges helps maintain morale and trust.
Follow-up actions include analyzing survey data for trends, communicating results transparently to employees, developing targeted improvement initiatives, setting measurable goals, and creating accountability timelines. Organizations should prioritize high-impact areas like management training, work-life balance programs, and recognition systems, with many companies finding that consistent follow-through significantly enhances employee engagement and retention rates.
Creating positive feedback loops involves transparently communicating survey results, implementing specific action plans with clear timelines, and regularly updating employees on progress made. Organizations enhance satisfaction by establishing follow-up surveys, creating employee committees to oversee changes, and recognizing departments that show improvement, with many companies finding that this continuous cycle of feedback, action, and communication ultimately delivers higher engagement and retention rates.
Technology enhances happiness surveys through automated distribution, real-time response tracking, advanced analytics with sentiment analysis, and AI-powered insights that identify patterns across demographics. These digital solutions streamline data collection, minimize manual processing, and deliver actionable dashboards, with many organizations finding that automated analysis reveals deeper employee satisfaction trends and enables faster, more targeted interventions.
Employee happiness survey biases include response bias, social desirability bias, recency bias, selection bias, and confirmation bias. These biases can skew results through employees providing expected rather than honest answers, recent events influencing responses, and non-representative participation rates, with many organizations finding that anonymous surveys and diverse question formats help minimize these distortions and deliver more accurate insights.
Involving employees in survey design increases engagement through focus groups, pilot testing, collaborative question development, and feedback sessions on survey structure and timing. These participatory approaches enhance buy-in by demonstrating that employee input shapes the process, while many organizations find that co-created surveys yield higher response rates and more actionable insights, ultimately delivering better workplace improvements.
**INPUT**: What strategies can we employ to communicate survey results and ensure transparency? **OUTPUT**: Effective communication strategies include comprehensive reports with visual dashboards, department-specific breakdowns, leadership presentations, and regular follow-up sessions with action plans. These approaches enhance transparency by delivering clear insights, accountability measures, and progress tracking, with many organizations finding that open communication paired with visible improvement initiatives ultimately builds trust and demonstrates genuine commitment to employee satisfaction. [Word count: 60 words]
Benchmark employee happiness through industry salary surveys, workplace culture reports from consulting firms like Deloitte or McKinsey, and platforms like Glassdoor or Indeed that provide competitor ratings. Many organizations also participate in "Best Places to Work" surveys, join industry associations for benchmarking data, and conduct market research, ultimately gaining competitive insights that enhance retention strategies.
-
SlideTeam provides PPTs on every single topic. Their templates suit my job very well. I am very grateful!
-
Unique research projects to present in meeting.