

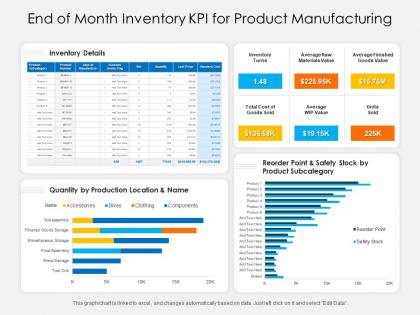
End of month inventory kpi for product manufacturing




Try Before you Buy Download Free Sample Product
 Impress Your
 Audience
 100%
100% Editable
 Save Hours
 of Time


Our End Of Month Inventory KPI For Product Manufacturing are topically designed to provide an attractive backdrop to any subject. Use them to look like a presentation pro.
People who downloaded this PowerPoint presentation also viewed the following :
End of month inventory kpi for product manufacturing with all 2 slides:
Use our End Of Month Inventory KPI For Product Manufacturing to effectively help you save your valuable time. They are readymade to fit into any presentation structure.
FAQs for End of month inventory kpi
Oh nice! So you'll definitely want inventory turnover ratio and days sales outstanding - those are like the bread and butter ones. Stockout frequency is huge too, plus your carrying costs as a percentage. Dead stock percentage will save your butt honestly, because finding out you're drowning in unsellable inventory is the worst. Fill rate and accuracy from cycle counts are solid additions. I'd probably throw together a simple dashboard showing month-over-month trends so you can catch weird patterns fast. Start with these basics and add more later if your team needs something specific!
Look, your end-of-month inventory numbers basically control how much cash you've got to work with. Too much stock sitting around? That's money just collecting dust when you could be using it for other stuff. Storage costs pile up too, which sucks. But run too lean and you'll deal with stockouts - trust me, angry customers aren't worth the saved cash. You want enough inventory to keep sales flowing without tying up tons of working capital. I'd say check your inventory turnover each month and see how you stack up against competitors. Find that balance that actually works for your specific business rhythm.
Count everything on the last day of the month once transactions wrap up. Use whatever costing method you normally do - FIFO, weighted average, whatever. Don't forget raw materials, WIP, and finished goods. Timing's honestly the part that screws most people over, but just stay consistent. Oh, and check those goods in transit carefully - whose are they really based on shipping terms? That stuff gets messy fast. I'd compare it against your perpetual system and jump on any big differences right away. Trust me, variances don't get better with age.
Honestly, it's all over the place depending on what you're selling. Retail keeps things pretty lean since stuff moves fast. Manufacturing? They're sitting on like 60-90 days of materials because their supply chains are a nightmare. Healthcare sits somewhere in between - can't run out of critical stuff but everything expires eventually (which is stressful as hell). Tech companies barely have physical inventory unless they're making actual hardware. You really need to look at what other companies in your space are doing and figure out what works with your cash flow. Industry benchmarks are your friend here.
Dude, you absolutely need a solid inventory management system for EOM tracking. Manual spreadsheets are a nightmare - trust me on this one. The system captures all your stock movements in real-time and calculates turnover ratios automatically. Plus it'll catch those annoying discrepancies between what's actually on shelves vs. what the computer thinks you have. Make sure it talks to your POS and procurement systems too, otherwise you're missing half the picture. Oh, and set up those automated reports now so you're not pulling your hair out when month-end hits. Just don't let your team create random workarounds!
So basically, track how much inventory you're sitting on each month - if those numbers keep climbing, that's your cash just stuck there doing nothing. I made this mistake big time when we had like 3 months of dead stock killing our budget. Super frustrating. Watch the trends and see which products aren't selling fast enough. High inventory = cash problem, so when you notice it creeping up, time to run sales or change what you're ordering. Gets that money moving again instead of collecting dust.
Honestly, most companies mess up by just looking at dollar amounts instead of tracking patterns over time. Seasonality matters way more than people think. Don't forget about that dead inventory sitting in your warehouse - it'll make your numbers look way better than they actually are. Here's the thing though: cutting inventory sounds great until your customers can't get what they need. You'll save money but piss everyone off. Oh, and compare yourself to industry benchmarks. Makes a huge difference when you know what's actually realistic for your type of business.
Honestly, your end-of-month inventory numbers are gonna drive pretty much every big supply chain decision you make. High inventory? You'll probably slow down procurement or even pause production on some products. Running low? That's when you scramble to fast-track orders and figure out which items to restock first. I always think of it as taking your supply chain's temperature, you know? The cool thing is spotting those seasonal trends - helps you nail down when to reorder and how much safety stock to keep. Don't just track the numbers though. Actually use them to set your reorder points.
So basically, track what you're actually running out of - those stockouts are what's pissing customers off. Look at your last few months of data and you'll spot the patterns pretty quick. Use that info to fix your reorder points so you're not constantly scrambling. Honestly, I've watched so many teams mess this up by not paying attention to their turnover rates. When you've got the right stuff in stock, customers aren't waiting around for backorders. Simple as that. Oh and safety stock levels matter too - don't sleep on those.
So you're tracking end-of-month inventory? Start with an ERP like SAP, Oracle, or NetSuite - they'll automatically sync all your data. Power BI or Tableau are perfect for dashboards that don't make your eyes bleed. Honestly, I've seen people do wonders with just Excel pivot tables if budget's tight, though it's way more manual work. Fishbowl and inFlow are decent middle-ground options too. The main thing is connecting it to your warehouse system so you're not stuck updating everything by hand each month. Trust me, automation here saves your sanity.
Look, monthly is the bare minimum but you'll want to do weekly reviews if you actually want to stay on top of things. Here's why - monthly just gives you the data after stuff's already gone wrong. Weekly lets you catch problems early. I made this mistake at my last job, waiting for month-end reports only to find out we'd been bleeding inventory for weeks. Fast-moving business or seasonal stuff? Maybe check bi-weekly at least. Honestly, start with weekly for your first three months, then figure out what rhythm works based on your patterns.
Yeah, your End of Month Inventory numbers are actually pretty telling about how well things are running overall. Accurate inventory levels mean you're not burning cash on excess stock or panicking when you can't fill orders. Both situations are efficiency killers, trust me. Good inventory tracking usually means your demand forecasting is solid and procurement isn't a mess. If your month-end numbers keep missing the mark, that's your canary in the coal mine - something's broken upstream in your processes. Watch the trends over a few months to see what patterns emerge.
Honestly, just use whatever you've got - spreadsheets work fine for most small businesses. Pick one day each month (I always do the last business day) and actually count your stuff, then compare it to what your system shows. The hardest part is sticking to it when you're crazy busy, but consistency matters way more than perfection. If counting everything feels like too much, just start with your bestsellers. You can always add more later. Month-to-month, watch your inventory value and look for weird patterns - are you losing stuff or sitting on too much stock? Basic tracking beats fancy systems every time.
Your End of Month Inventory KPI gets hit by tons of stuff outside your control. Supply chain issues are the worst - late deliveries completely screw up your numbers. Seasonal changes mess with demand patterns too, especially in retail. Economic shifts change how customers buy and how reliable your suppliers are. Weather's weirdly disruptive - storms delay shipments, extreme heat ruins products. Honestly, I've seen companies panic over inventory variances that were totally out of their hands. You should track these external factors alongside your KPI. Makes it way easier to explain the weird numbers to your boss and fix your forecasting.
Honestly, turning those inventory numbers into charts makes such a huge difference. Your stakeholders will actually pay attention instead of glazing over at spreadsheet rows. Heat maps work great for stock levels - you'll spot overstocking issues right away. Trend lines show historical patterns, and bar charts are perfect for comparing where you are vs targets. I mean, nobody wants to decode boring data tables in meetings. The visual stuff helps execs make decisions faster since patterns jump out immediately. Trust me, once you make it visual, people actually engage with the numbers.
-
Topic best represented with attractive design.
-
Illustrative design with editable content. Exceptional value for money. Highly pleased with the product.