

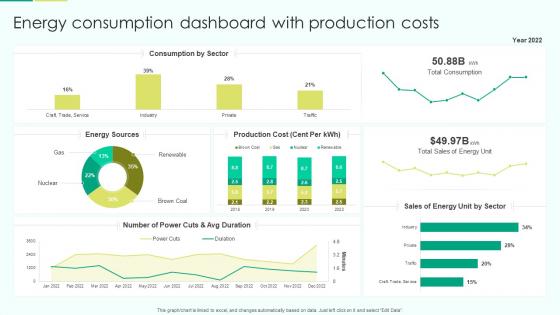
Energy Consumption Dashboard With Production Costs




Try Before you Buy Download Free Sample Product
 Impress Your
Audience
 100%
Editable
 Save Hours
of Time


Our Energy Consumption Dashboard With Production Costs are topically designed to provide an attractive backdrop to any subject. Use them to look like a presentation pro.
People who downloaded this PowerPoint presentation also viewed the following :
Energy Consumption Dashboard With Production Costs with all 7 slides:
Use our Energy Consumption Dashboard With Production Costs to effectively help you save your valuable time. They are readymade to fit into any presentation structure.






FAQs for Energy Consumption Dashboard
**INPUT**: What key metrics should an energy dashboard display for effective monitoring? **OUTPUT**: Energy dashboards should display real-time consumption data, peak demand periods, cost per unit trends, carbon footprint metrics, and equipment efficiency ratings across facilities. These comprehensive metrics enable organizations to identify usage patterns, optimize resource allocation, and reduce operational costs, with many manufacturing plants and commercial buildings finding that strategic monitoring delivers significant energy savings and enhanced sustainability reporting. [Word count: 58 words]
Real-time data integration enhances energy dashboard functionality by enabling immediate consumption monitoring, automated alerts for anomalies, predictive maintenance scheduling, and dynamic load balancing across systems. Through continuous data streams from smart meters and sensors, facility managers can optimize energy usage patterns, reduce operational costs by up to 20%, and respond instantly to peak demand situations, ultimately delivering enhanced efficiency and strategic cost management.
AI and machine learning in energy dashboards deliver predictive analytics, automated anomaly detection, demand forecasting, real-time optimization, and intelligent alert systems. These technologies enhance operational efficiency by identifying consumption patterns, predicting equipment failures, and optimizing energy distribution, with utilities and manufacturing facilities finding significantly reduced costs and improved grid reliability.
Energy dashboards contribute to sustainability goals by providing real-time visibility into consumption patterns, identifying waste reduction opportunities, and tracking progress toward environmental targets. Through automated monitoring and analytics, organizations streamline resource management, minimize carbon footprints, and demonstrate measurable sustainability outcomes to stakeholders, ultimately delivering both environmental benefits and operational cost savings.
**INPUT**: What are common challenges businesses face when implementing energy dashboards? **OUTPUT**: Common challenges include data integration complexities, ensuring real-time accuracy, managing multiple energy sources, establishing baseline metrics, and achieving user adoption across departments. While these obstacles initially require strategic planning and resource allocation, organizations in manufacturing, healthcare, and retail increasingly find that systematic implementation delivers enhanced operational visibility, streamlined energy management, and ultimately significant cost reductions. [Word count: 58 words]
Behavioral insights can be incorporated through gamification elements, social comparisons with peer consumption, personalized recommendations based on usage patterns, and real-time feedback loops that reward conservation efforts. These psychological motivators enhance user engagement by leveraging competitive instincts and social dynamics, with many utilities finding that behavioral nudges increase energy conservation by 10-15% while improving customer satisfaction.
Visualizations serve as the critical interface between complex energy data and actionable insights, transforming raw consumption metrics, efficiency trends, and cost analyses into intuitive charts, graphs, and real-time displays. These visual elements enable facility managers, executives, and operations teams to quickly identify patterns, anomalies, and optimization opportunities, ultimately streamlining decision-making and enhancing operational efficiency across organizations.
Energy dashboards assist in identifying consumption reduction patterns by visualizing real-time usage data, tracking peak demand periods, comparing historical trends, and highlighting inefficient equipment or processes. Through advanced analytics and automated alerts, facilities managers can pinpoint energy waste, optimize operational schedules, and implement targeted conservation strategies, ultimately delivering significant cost savings and enhanced sustainability performance across their organizations.
**INPUT**: What tools and technologies are most effective for building an energy dashboard? **OUTPUT**: Effective energy dashboard technologies include IoT sensors, SCADA systems, cloud analytics platforms, real-time data visualization tools, and machine learning algorithms for predictive insights. These solutions streamline energy monitoring by integrating multiple data sources, automating reporting processes, and delivering actionable intelligence, with manufacturing facilities and commercial buildings finding that comprehensive dashboards reduce operational costs while enhancing sustainability performance. **Word count: 60 words**
Mobile accessibility transforms energy dashboards by enabling real-time monitoring from anywhere, providing instant alerts for anomalies, and allowing quick adjustments to optimize consumption patterns. Through responsive design and touch-optimized interfaces, facility managers can track energy usage during site visits, respond to critical alerts immediately, and make data-driven decisions remotely, ultimately delivering faster response times and enhanced operational efficiency.
Manufacturing, healthcare, retail, hospitality, and data centers benefit most from energy dashboards due to their high consumption and operational complexity. These sectors leverage real-time monitoring to identify inefficiencies, reduce utility costs, and meet sustainability targets, with many large facilities finding that comprehensive energy visibility delivers 10-15% cost reductions while enhancing regulatory compliance.
Energy dashboards aid regulatory compliance by automatically tracking emissions data, monitoring energy usage thresholds, generating standardized reports, and providing real-time alerts for potential violations. These systems streamline compliance processes by centralizing documentation, automating regulatory submissions, and maintaining audit trails, with utilities and manufacturing companies finding that comprehensive dashboards significantly reduce compliance costs while ensuring consistent adherence to environmental regulations.
**INPUT**: What data sources should be prioritized for input into an energy dashboard? **OUTPUT**: Energy dashboards should prioritize real-time consumption data, utility meter readings, equipment performance metrics, weather conditions, and cost analytics as primary inputs. These data sources enable organizations to streamline energy management by identifying inefficiencies, predicting demand patterns, and optimizing resource allocation, with many manufacturing facilities and commercial buildings finding significant cost reductions through comprehensive monitoring. [Word count: 60]
Energy dashboards help forecast future energy needs by analyzing historical consumption patterns, tracking seasonal variations, identifying peak demand periods, and monitoring usage trends across different facilities or departments. Through predictive analytics and real-time data visualization, organizations can anticipate capacity requirements, optimize resource allocation, and plan infrastructure investments, ultimately enabling proactive energy management and cost reduction strategies.
User feedback mechanisms that enhance energy dashboard effectiveness include surveys, usage analytics, A/B testing, focus groups, and interactive feedback widgets. These approaches streamline dashboard optimization by identifying user pain points, improving interface design, and enhancing data visualization preferences, with many organizations finding that continuous feedback loops ultimately deliver more intuitive experiences and increased user engagement across their energy management systems.
-
Great quality product.
-
Crisp and neat slides. Makes it fun and easier to curate presentations.