

Energy Monitoring System Powerpoint Presentation Slides





Try Before you Buy Download Free Sample Product
 Impress Your
Audience
 100%
Editable
 Save Hours
of Time


Continuously monitor the performance of your system by employing the Energy Monitoring System Powerpoint Presentation Slides. Establish baseline and showcase objectives, goals, accountability with the aid of this content ready energy management PowerPoint complete deck. Utilize the power management PowerPoint visuals and estimate the potential for improvement. The performance of this system can be assessed by gathering and collecting data and by tracking energy conservation projects. Make a quantitative and qualitative review to analyze the data. Showcase the steps to conduct a technical assessment and audits with the aid of energy procurement PowerPoint graphics. Also, determine roles and resources and create a communication plan with the help of energy demand management PPT slideshow. Showcase how you can raise awareness of energy conservation among people by conducting workshops, seminars, and training. Download our professionally designed energy efficiency PowerPoint presentation to create an action plan & set timelines.
People who downloaded this PowerPoint presentation also viewed the following :
Content of this Powerpoint Presentation
Slide 1: This slide introduces Energy Monitoring System. State your company name and begin.
Slide 2: This slide displays the Outline of the presentation.
Slide 3: This slide displays Commit to continuous improvement.
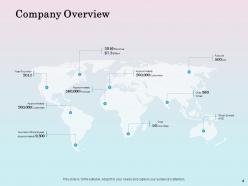
Slide 4: This slide displays Company Overview.
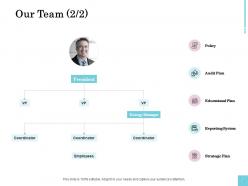
Slide 5: This is Our Team slide with names and designation.
Slide 6: This is also Our Team slide.
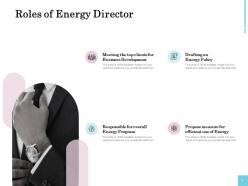
Slide 7: This slide showcases the Roles of Energy Director.
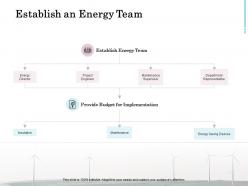
Slide 8: This slide displays Establishing an Energy Team.
Slide 9: This is Institute an Energy Policy slide such as- State an Objective, Establish Accountability, Ensure Continuous Improvement, Promote Goals.
Slide 10: This slide is about Setting Goals.
Slide 11: This is Determine Scope slide displaying- Organization-wide, Facility, Process or Equipment, Organizational Level, Short-Term Goals, Long-Term Goals, Time Periods.
Slide 12: This slide depicts Estimate Potential for Improvement.
Slide 13: This is Establish Goals slide.
Slide 14: This slide displays assess performance.
Slide 15: This slide showcases Gather and Track Data with- Sample, Population, Census, Sampling Frame, Simple Random Sample, Sampling Variability.
Slide 16: This slide depicts Gather and Track Data with- Determine Appropriate Level of Detail, Account for all Energy Sources, Document all Energy Uses, Collect Facility & Operational Data.
Slide 17: This slide displays Energy Conservation Projects Tracking.
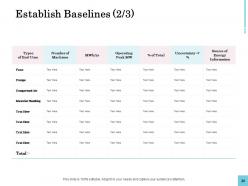
Slide 18: This is Establish Baselines slide.
Slide 19: This is Establish Baselines slide.
Slide 20: This is also Establish Baselines slide.
Slide 21: This slide showcases Benchmarking with- Potential Annual Savings on Electricity, Potential Annual Savings on Natural Gas, Potential Annual Energy Savings, Facility Energy Intensity.
Slide 22: This slide displays Benchmarking showcasing- Past Performance, Industry Average, Best in Class, Best Practices.
Slide 23: This slide depicts analyze data.
Slide 24: This is Conduct Technical Assessments and Audits slide.
Slide 25: This is also Conduct Technical Assessments and Audits slide.
Slide 26: This slide displays Track and Monitor
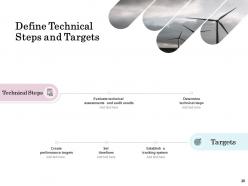
Slide 27: This slide is about Defining Technical Steps and Targets with- Technical Steps, Evaluate Technical Assessments and Audit Results, Determine Technical Steps, Create Performance Targets.
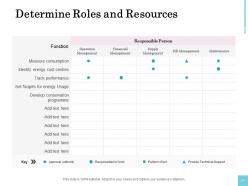
Slide 28: This slide showcases Roles and Resources describing- Responsible Person, Responsible for Work, Approval Authority, Perform Work, Provide Technical Support.
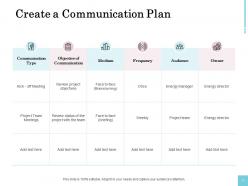
Slide 29: This is Create a Communication Plan slide.
Slide 30: This slide displays implement action plan with- Create a Communication Plan, Raise Awareness, Build Capacity, Motivate.
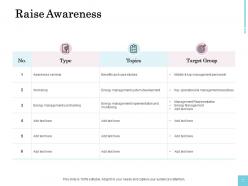
Slide 31: This is Raise Awareness slide.
Slide 32: This slide showcases Build Capacity.
Slide 33: This is motivate slide describing internal competition, recoginition, financial bonus and prizes etc.
Slide 34: This slide displays Track and Monitor.
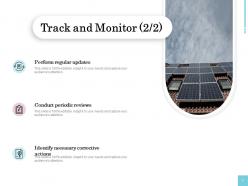
Slide 35: This slide displays Track and Monitor with- Perform Regular Updates, Conduct Periodic Reviews, Identify Necessary Corrective Actions.
Slide 36: This slide showcases Review Action Plan with evaluate progress, measure results.
Slide 37: This slide showcases measure results.
Slide 38: This is Review Action Plan slide.
Slide 39: This slide showcases Recognize Achievements displaying- Internal Recognition, External Recognition.
Slide 40: This slide depicts Internal Recognition with- Celebrate success, Promote energy saving, Offer financial rewards, Set Recognition Criteria, Energy saving ideas, Energy Use Reduction, Increase Savings, Set Recognition Levels.
Slide 41: This slide depicts External Recognition with- Membership Associations and Industry Bodies, Participate in established groups, Sharing results, Performance Standards, Achievement certificates, Achievement Awards, Creates goodwill, Gain customer and supplier support.
Slide 42: This is KPI Metrics and Dashboard slide.
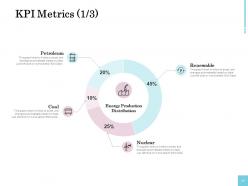
Slide 43: This slide showcases Energy Production Distribution.
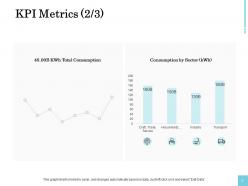
Slide 44: This is KPI Metrics slide showcasing total consumption, Consumption By Sector (kWh).
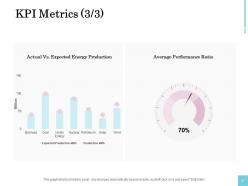
Slide 45: This slide also showcases KPI Metrics with Actual Vs. Expected Energy Production, Average Performance Ration.
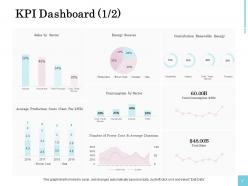
Slide 46: This is KPI Dashboard slide showcasing percentages of contribution of renewable energy to household, industry, craft, trade, service.
Slide 47: This is KPI Dashboard slide with- Project Delivery, Production Distribution (B kWh), Renewable, Nuclear, Coal, Gas, Energy Savings – B kWh, Performance Ratio Availability Factor, Production (kWh), Performance Ratio.
Slide 48: This is Energy Conservation Icons Slide.
Slide 49: This slide is titled as Additional Slides for moving forward.
Slide 50: This slide displays time for Coffee break.
Slide 51: This slide displays Line Chart.
Slide 52: This slide displays Bar Chart with product comparison.
Slide 53: This slide displays Column Chart with product comparison.
Slide 54: This is Venn slide.
Slide 55: This is financial slide.
Slide 56: This is our goals slide to showcase company goals.
Slide 57: This is quotes slide.
Slide 58: This is location slide with percentages of male and female population in the particular country.
Slide 59: This is about us slide.
Slide 60: This is idea generation slide to highlight important ideas, information and facts.
Slide 61: This is our mission slide.
Slide 62: This is our team slide with names and designation.
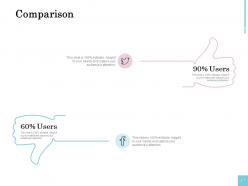
Slide 63: This is comparison slide with percentages of twitter and facebook users.
Slide 64: This is contact us slide with address, email address and contact number.
Energy Monitoring System Powerpoint Presentation Slides with all 64 slides:
Use our Energy Monitoring System Powerpoint Presentation Slides to effectively help you save your valuable time. They are readymade to fit into any presentation structure.



















FAQs for Energy Monitoring System
You'll need smart meters to track usage, plus some kind of central hub to pull all that data together. Real-time dashboards are a must - waiting weeks to spot problems is just dumb. Communication setup matters too, whether you go wireless or hardwired. Analytics software turns the raw numbers into something useful. Oh, and make sure whatever you pick plays nice with your current building systems. Last thing you want is another isolated tool that sits there collecting dust because it doesn't talk to anything else.
Dude, real-time monitoring is a game changer - you catch energy waste the second it happens instead of getting slammed with a crazy bill later. Like when your HVAC is being inefficient or equipment's sucking way too much power. Honestly, seeing all that live data for the first time is wild. You can fix stuff immediately rather than playing detective with last month's charges. Oh, and definitely set up alerts for weird consumption spikes. That way you're not glued to your phone checking dashboards every five minutes but you'll still know if something's off.
Honestly, IoT is like the nervous system for tracking energy usage - sensors everywhere talking to each other and feeding you real-time data. Way better than those useless monthly bills that just show a big number. Your HVAC, individual machines, lighting - everything gets monitored continuously and dumps data into cloud platforms where you can actually spot the energy hogs. I'd start small though, maybe pick 2-3 critical systems first. Don't go crazy trying to sensor everything day one or you'll overwhelm yourself with data you can't even process yet.
Honestly, just compare your energy bills from before you installed the system to now - that's gonna tell you everything. Most monitoring apps will show you month-to-month changes automatically, which is super helpful. Take your reduced kWh and multiply by your utility rate to see actual dollar savings. Weather changes can mess with your numbers though, so factor that in. Same with production changes if it's a business. I'd run monthly reports to see what's actually working - some upgrades pay off way more than others, and it's cool to see which ones are crushing it.
Ugh, compatibility issues are the worst part honestly. Your old equipment definitely wasn't built for this stuff, so retrofitting gets super messy - especially if you're dealing with ancient electrical panels and random wiring. Nothing talks to each other properly either, which is annoying. You'll spend forever trying to get different systems to communicate with your main hub. Also plan for way more downtime than seems reasonable. I'd start by mapping your most critical systems first and tackle those. Oh and older buildings are just... good luck with that.
Honestly, energy monitoring systems are total game-changers for going green. They show you exactly where your power's getting wasted in real-time. Start with your biggest energy hogs first - you'll spot inefficiencies you never knew existed. The data helps cut unnecessary usage and track your carbon goals. Quick wins happen faster than you'd think, and they usually save money right away too. I actually helped a friend set one up last year, and within a month they found their old HVAC system was running 24/7 for no reason. You'll be shocked at the low-hanging fruit once you start monitoring.
Track your peak demand times first - that's where the real money gets wasted. Then look at total energy use by department and power factor efficiency. I'd also check energy costs per square foot and watch trends monthly to see if you're actually making progress or just spinning your wheels. Temperature-adjusted usage helps since weather messes with HVAC big time. Oh, and definitely monitor baseline usage during off-hours - you'll catch equipment running when nobody's around. Honestly, start monthly then go weekly once you find something weird worth digging into.
So energy monitoring is like having a window into your power usage - you can see exactly when you're burning through electricity. The cool part? You'll spot those expensive peak hours and shift stuff to run when rates drop. Picture a dashboard showing your daily energy patterns. Some systems will automatically move equipment to cheaper time slots, or just ping you when it's time to dial things back. Honestly, the automation piece is pretty slick. A bunch of these integrate right into utility programs too. Bottom line - instead of running everything whenever, you're making moves based on actual data about timing and costs.
So many ways to dig into that energy data! Start with basic consumption trends - see where your money's actually going over time. Peak usage periods are huge too, plus you can break costs down by department or equipment. The anomaly detection stuff is honestly a game changer - catches weird spikes that usually mean something's breaking before you'd notice otherwise. You'll get efficiency metrics like energy per production unit, which is pretty neat. Oh, and predictive analytics for forecasting future costs. Industry benchmarking helps identify your worst energy wasters. I'd say jump into trend analysis first since it's the clearest starting point.
Honestly, these systems are lifesavers for compliance stuff. They automatically track all your energy data and spit out those detailed reports regulators love. When you're getting close to usage limits, they'll alert you before things get messy. The audit trails are built right in, so you've got proof you're following environmental rules without scrambling around later. What I really like is how they catch problems early - way better than dealing with violations after the fact. Most can export everything in whatever format your compliance people need too. No more pulling reports at 11pm when audit season hits (been there, it sucks).
You're probably looking at $2-15K upfront depending on how big your place is and what bells and whistles you want. Then maybe $200-500 yearly for software and maintenance stuff. Takes about 1-3 days to install if you pick a decent company - seriously, don't just go with whoever's cheapest because that'll bite you later. Most people break even in like 12-18 months from the energy savings alone. The cool part is you'll actually catch problems before they show up on your bill months down the road. I'd definitely get quotes from 2-3 different vendors so you can see what you're getting for your money.
Dude, ML totally changes the game for energy predictions. It spots weird patterns you'd miss - like how your HVAC goes nuts when it's humid on certain days (sounds random but happens all the time). Instead of just basic trending, these algorithms dig into your historical data, weather patterns, building schedules, all that stuff. They get smarter as they learn too. Honestly, once you collect about 6 months of detailed usage data, you can run time-series forecasting and watch your demand planning actually make sense for once.
So basically, when you add renewables to your energy monitoring setup, you can actually see what's happening with your energy mix in real-time. Really satisfying watching those solar panels kick in on the dashboard, not gonna lie. You'll spot which renewable sources are slacking and figure out the best times to switch between grid power and your clean energy. The consumption patterns become super clear too. Best part? You're cutting costs by using more of your own renewable power, plus you've got the data to show off your sustainability wins to whoever needs to see it.
Honestly, UI design can make or break these energy monitoring systems. People won't touch it if the dashboard looks like a spreadsheet threw up everywhere. Keep the main metrics front and center - make them actually readable at a glance. I've watched companies blow serious money on systems that just dump raw data with zero context. Nobody wants to decode that mess. Your design needs consistent patterns and easy drilling down into specifics. Oh, and don't overthink the colors or whatever. Simple beats fancy every time. Seriously though, get the UX right from day one or you'll have an expensive paperweight.
Honestly, the whole AI thing is going to flip these systems upside down. Predictive analytics will catch equipment problems way before they break - which is actually pretty sweet. Everything's getting connected now too, like your HVAC talking to individual light bulbs through IoT. Real-time data won't cost extra anymore, it'll just be standard. Edge computing processes stuff locally so responses happen instantly. Oh, and blockchain might handle energy trading between buildings (still sounds weird to me but whatever). My advice? Get systems now that play nice with multiple data sources. Makes upgrades way less painful down the road.
-
Top Quality presentations that are easily editable.