

Sistema de Monitoreo de Energía Diapositivas de Presentación de PowerPoint





Try Before you Buy Download Free Sample Product
 Impress Your
Audience
 100%
Editable
 Save Hours
of Time


Monitorea continuamente el rendimiento de su sistema empleando las Diapositivas de Presentación del Sistema de Monitoreo de Energía. Establezca una línea de base y muestre los objetivos, metas y responsabilidades con la ayuda de este conjunto completo de contenido listo para la presentación de PowerPoint de gestión energética. Utilice los visuales de PowerPoint de gestión de energía y estime el potencial de mejora. El rendimiento de este sistema se puede evaluar recopilando y recopilando datos y haciendo un seguimiento de los proyectos de conservación de energía. Realice una revisión cuantitativa y cualitativa para analizar los datos. Muestre los pasos para realizar una evaluación técnica y auditorías con la ayuda de gráficos de PowerPoint de adquisición de energía. Además, determine roles y recursos y cree un plan de comunicación con la ayuda de la presentación de PowerPoint de gestión de la demanda de energía. Muestre cómo puede crear conciencia sobre la conservación de energía entre las personas mediante la realización de talleres, seminarios y capacitaciones. Descargue nuestra presentación de PowerPoint de eficiencia energética diseñada profesionalmente para crear un plan de acción y establecer plazos.
People who downloaded this PowerPoint presentation also viewed the following :
Contenido de esta presentación de Powerpoint
Diapositiva 1: Esta diapositiva presenta el Sistema de Monitoreo de Energía. Indique el nombre de su empresa y comience.
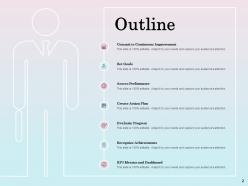
Diapositiva 2: Esta diapositiva muestra el Esquema de la presentación.
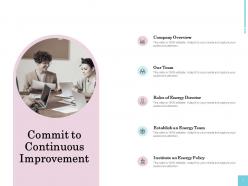
Diapositiva 3: Esta diapositiva muestra el Compromiso con la mejora continua.
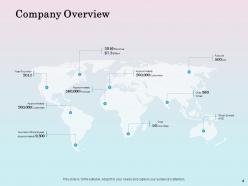
Diapositiva 4: Esta diapositiva muestra la Descripción General de la Empresa.
Diapositiva 5: Esta es la diapositiva de Nuestro Equipo con nombres y cargos.
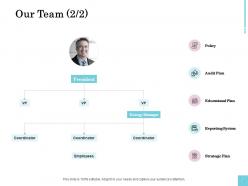
Diapositiva 6: Esta es también la diapositiva de Nuestro Equipo.
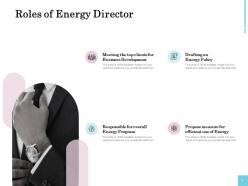
Diapositiva 7: Esta diapositiva muestra los Roles del Director de Energía.
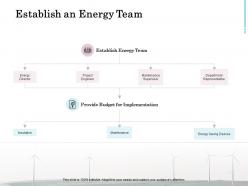
Diapositiva 8: Esta diapositiva muestra el Establecimiento de un Equipo de Energía.
Diapositiva 9: Esta es la diapositiva del Instituto de una Política Energética, como: Establecer un Objetivo, Establecer Responsabilidades, Garantizar la Mejora Continua, Promover Metas.
Diapositiva 10: Esta diapositiva trata sobre el Establecimiento de Metas.
Diapositiva 11: Esta es la diapositiva Determinar el Alcance que muestra: En toda la organización, Instalación, Proceso o Equipo, Nivel Organizacional, Metas a Corto Plazo, Metas a Largo Plazo, Períodos de Tiempo.
Diapositiva 12: Esta diapositiva representa Estimar el Potencial de Mejora.
Diapositiva 13: Esta es la diapositiva Establecer Metas.
Diapositiva 14: Esta diapositiva muestra evaluar el desempeño.
Diapositiva 15: Esta diapositiva muestra Recopilar y Rastrear Datos con: Muestra, Población, Censo, Marco de Muestreo, Muestra Aleatoria Simple, Variabilidad de Muestreo.
Diapositiva 16: Esta diapositiva representa Recopilar y Rastrear Datos con: Determinar el Nivel de Detalle Apropiado, Contabilizar todas las Fuentes de Energía, Documentar todos los Usos de Energía, Recopilar Datos de Instalaciones y Operacionales.
Diapositiva 17: Esta diapositiva muestra el Seguimiento de Proyectos de Conservación de Energía.
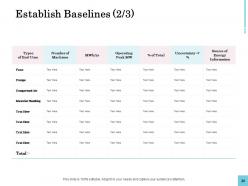
Diapositiva 18: Esta es la diapositiva Establecer Líneas Base.
Diapositiva 19: Esta es la diapositiva Establecer Líneas Base.
Diapositiva 20: Esta es también la diapositiva Establecer Líneas Base.
Diapositiva 21: Esta diapositiva muestra el Benchmarking con: Ahorro Anual Potencial en Electricidad, Ahorro Anual Potencial en Gas Natural, Ahorro Anual de Energía Potencial, Intensidad Energética de las Instalaciones.
Diapositiva 22: Esta diapositiva muestra el Benchmarking con: Desempeño Pasado, Promedio de la Industria, Mejor de su Clase, Mejores Prácticas.
Diapositiva 23: Esta diapositiva representa analizar datos.
Diapositiva 24: Esta es la diapositiva Realizar Evaluaciones Técnicas y Auditorías.
Diapositiva 25: Esta es también la diapositiva Realizar Evaluaciones Técnicas y Auditorías.
Diapositiva 26: Esta diapositiva muestra Rastrear y Monitorear
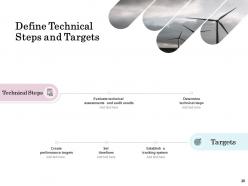
Diapositiva 27: Esta diapositiva trata sobre Definir Pasos Técnicos y Objetivos con: Pasos Técnicos, Evaluar Resultados de Evaluaciones Técnicas y Auditorías, Determinar Pasos Técnicos, Crear Objetivos de Desempeño.
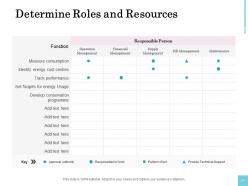
Diapositiva 28: Esta diapositiva muestra Roles y Recursos que describen: Persona Responsable, Responsable del Trabajo, Autoridad de Aprobación, Realizar el Trabajo, Brindar Soporte Técnico.
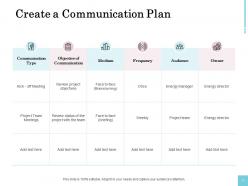
Diapositiva 29: Esta es la diapositiva Crear un Plan de Comunicación.
Diapositiva 30: Esta diapositiva muestra implementar un plan de acción con: Crear un Plan de Comunicación, Crear Conciencia, Desarrollar Capacidades, Motivar.
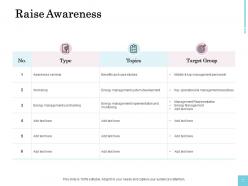
Diapositiva 31: Esta es la diapositiva Crear Conciencia.
Diapositiva 32: Esta diapositiva muestra Desarrollar Capacidades.
Diapositiva 33: Esta es la diapositiva motivar que describe la competencia interna, el reconocimiento, los bonos financieros y los premios, etc.
Diapositiva 34: Esta diapositiva muestra Rastrear y Monitorear.
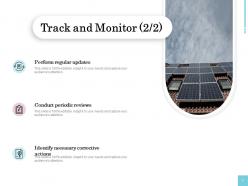
Diapositiva 35: Esta diapositiva muestra Rastrear y Monitorear con: Realizar Actualizaciones Periódicas, Realizar Revisiones Periódicas, Identificar Acciones Correctivas Necesarias.
Diapositiva 36: Esta diapositiva muestra Revisar el Plan de Acción con evaluar el progreso, medir resultados.
Diapositiva 37: Esta diapositiva muestra medir resultados.
Diapositiva 38: Esta es la diapositiva Revisar el Plan de Acción.
Diapositiva 39: Esta diapositiva muestra Reconocer Logros con: Reconocimiento Interno, Reconocimiento Externo.
Diapositiva 40: Esta diapositiva representa el Reconocimiento Interno con: Celebrar el éxito, Promover el ahorro de energía, Ofrecer recompensas financieras, Establecer Criterios de Reconocimiento, Ideas de ahorro de energía, Reducción del Uso de Energía, Aumentar los Ahorros, Establecer Niveles de Reconocimiento.
Diapositiva 41: Esta diapositiva representa el Reconocimiento Externo con: Asociaciones y Organismos de la Industria, Participar en grupos establecidos, Compartir resultados, Estándares de Desempeño, Certificados de Logro, Premios de Logro, Crea buena voluntad, Obtener el apoyo de clientes y proveedores.
Diapositiva 42: Esta es la diapositiva de Métricas y Tablero de KPI.
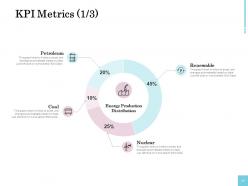
Diapositiva 43: Esta diapositiva muestra la Distribución de Producción de Energía.
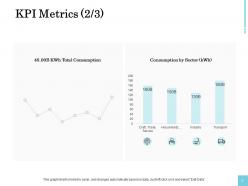
Diapositiva 44: Esta es la diapositiva de Métricas de KPI que muestra el consumo total, Consumo por Sector (kWh).
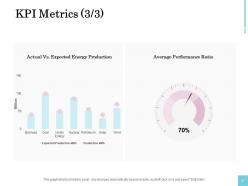
Diapositiva 45: Esta diapositiva también muestra Métricas de KPI con Producción de Energía Real Vs. Esperada, Ratio de Desempeño Promedio.
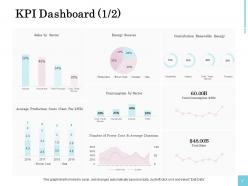
Diapositiva 46: Esta es la diapositiva del Tablero de KPI que muestra los porcentajes de contribución de la energía renovable al hogar, la industria, la artesanía, el comercio y los servicios.
Diapositiva 47: Esta es la diapositiva del Tablero de KPI con: Entrega de Proyectos, Distribución de Producción (B kWh), Renovable, Nuclear, Carbón, Gas, Ahorro de Energía - B kWh, Factor de Disponibilidad de Ratio de Desempeño, Producción (kWh), Ratio de Desempeño.
Diapositiva 48: Esta es la Diapositiva de Iconos de Conservación de Energía.
Diapositiva 49: Esta diapositiva se titula Diapositivas Adicionales para avanzar.
Diapositiva 50: Esta diapositiva muestra el tiempo para un Descanso para Café.
Diapositiva 51: Esta diapositiva muestra un Gráfico de Líneas.
Diapositiva 52: Esta diapositiva muestra un Gráfico de Barras con comparación de productos.
Diapositiva 53: Esta diapositiva muestra un Gráfico de Columnas con comparación de productos.
Diapositiva 54: Esta es una diapositiva de Venn.
Diapositiva 55: Esta es una diapositiva financiera.
Diapositiva 56: Esta es nuestra diapositiva de metas para mostrar las metas de la empresa.
Diapositiva 57: Esta es una diapositiva de citas.
Diapositiva 58: Esta es una diapositiva de ubicación con porcentajes de población masculina y femenina en un país en particular.
Diapositiva 59: Esta es una diapositiva sobre nosotros.
Diapositiva 60: Esta es una diapositiva de generación de ideas para resaltar ideas, información y hechos importantes.
Diapositiva 61: Esta es nuestra diapositiva de misión.
Diapositiva 62: Esta es nuestra diapositiva de equipo con nombres y cargos.
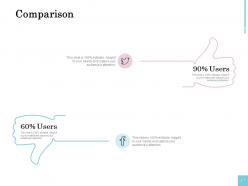
Diapositiva 63: Esta es una diapositiva de comparación con porcentajes de usuarios de Twitter y Facebook.
Diapositiva 64: Esta es una diapositiva de contáctenos con dirección, dirección de correo electrónico y número de contacto.
Monitoreo de energía Sistema Presentación de diapositivas de PowerPoint con las 64 diapositivas:
Utiliza nuestras Diapositivas de Presentación del Sistema de Monitoreo de Energía para ayudarte a ahorrar tiempo valioso. Están listas para adaptarse a cualquier estructura de presentación.




















FAQs for Energy Monitoring System
You'll need smart meters to track usage, plus some kind of central hub to pull all that data together. Real-time dashboards are a must - waiting weeks to spot problems is just dumb. Communication setup matters too, whether you go wireless or hardwired. Analytics software turns the raw numbers into something useful. Oh, and make sure whatever you pick plays nice with your current building systems. Last thing you want is another isolated tool that sits there collecting dust because it doesn't talk to anything else.
Dude, real-time monitoring is a game changer - you catch energy waste the second it happens instead of getting slammed with a crazy bill later. Like when your HVAC is being inefficient or equipment's sucking way too much power. Honestly, seeing all that live data for the first time is wild. You can fix stuff immediately rather than playing detective with last month's charges. Oh, and definitely set up alerts for weird consumption spikes. That way you're not glued to your phone checking dashboards every five minutes but you'll still know if something's off.
Honestly, IoT is like the nervous system for tracking energy usage - sensors everywhere talking to each other and feeding you real-time data. Way better than those useless monthly bills that just show a big number. Your HVAC, individual machines, lighting - everything gets monitored continuously and dumps data into cloud platforms where you can actually spot the energy hogs. I'd start small though, maybe pick 2-3 critical systems first. Don't go crazy trying to sensor everything day one or you'll overwhelm yourself with data you can't even process yet.
Honestly, just compare your energy bills from before you installed the system to now - that's gonna tell you everything. Most monitoring apps will show you month-to-month changes automatically, which is super helpful. Take your reduced kWh and multiply by your utility rate to see actual dollar savings. Weather changes can mess with your numbers though, so factor that in. Same with production changes if it's a business. I'd run monthly reports to see what's actually working - some upgrades pay off way more than others, and it's cool to see which ones are crushing it.
Ugh, compatibility issues are the worst part honestly. Your old equipment definitely wasn't built for this stuff, so retrofitting gets super messy - especially if you're dealing with ancient electrical panels and random wiring. Nothing talks to each other properly either, which is annoying. You'll spend forever trying to get different systems to communicate with your main hub. Also plan for way more downtime than seems reasonable. I'd start by mapping your most critical systems first and tackle those. Oh and older buildings are just... good luck with that.
Honestly, energy monitoring systems are total game-changers for going green. They show you exactly where your power's getting wasted in real-time. Start with your biggest energy hogs first - you'll spot inefficiencies you never knew existed. The data helps cut unnecessary usage and track your carbon goals. Quick wins happen faster than you'd think, and they usually save money right away too. I actually helped a friend set one up last year, and within a month they found their old HVAC system was running 24/7 for no reason. You'll be shocked at the low-hanging fruit once you start monitoring.
Track your peak demand times first - that's where the real money gets wasted. Then look at total energy use by department and power factor efficiency. I'd also check energy costs per square foot and watch trends monthly to see if you're actually making progress or just spinning your wheels. Temperature-adjusted usage helps since weather messes with HVAC big time. Oh, and definitely monitor baseline usage during off-hours - you'll catch equipment running when nobody's around. Honestly, start monthly then go weekly once you find something weird worth digging into.
So energy monitoring is like having a window into your power usage - you can see exactly when you're burning through electricity. The cool part? You'll spot those expensive peak hours and shift stuff to run when rates drop. Picture a dashboard showing your daily energy patterns. Some systems will automatically move equipment to cheaper time slots, or just ping you when it's time to dial things back. Honestly, the automation piece is pretty slick. A bunch of these integrate right into utility programs too. Bottom line - instead of running everything whenever, you're making moves based on actual data about timing and costs.
So many ways to dig into that energy data! Start with basic consumption trends - see where your money's actually going over time. Peak usage periods are huge too, plus you can break costs down by department or equipment. The anomaly detection stuff is honestly a game changer - catches weird spikes that usually mean something's breaking before you'd notice otherwise. You'll get efficiency metrics like energy per production unit, which is pretty neat. Oh, and predictive analytics for forecasting future costs. Industry benchmarking helps identify your worst energy wasters. I'd say jump into trend analysis first since it's the clearest starting point.
Honestly, these systems are lifesavers for compliance stuff. They automatically track all your energy data and spit out those detailed reports regulators love. When you're getting close to usage limits, they'll alert you before things get messy. The audit trails are built right in, so you've got proof you're following environmental rules without scrambling around later. What I really like is how they catch problems early - way better than dealing with violations after the fact. Most can export everything in whatever format your compliance people need too. No more pulling reports at 11pm when audit season hits (been there, it sucks).
You're probably looking at $2-15K upfront depending on how big your place is and what bells and whistles you want. Then maybe $200-500 yearly for software and maintenance stuff. Takes about 1-3 days to install if you pick a decent company - seriously, don't just go with whoever's cheapest because that'll bite you later. Most people break even in like 12-18 months from the energy savings alone. The cool part is you'll actually catch problems before they show up on your bill months down the road. I'd definitely get quotes from 2-3 different vendors so you can see what you're getting for your money.
Dude, ML totally changes the game for energy predictions. It spots weird patterns you'd miss - like how your HVAC goes nuts when it's humid on certain days (sounds random but happens all the time). Instead of just basic trending, these algorithms dig into your historical data, weather patterns, building schedules, all that stuff. They get smarter as they learn too. Honestly, once you collect about 6 months of detailed usage data, you can run time-series forecasting and watch your demand planning actually make sense for once.
So basically, when you add renewables to your energy monitoring setup, you can actually see what's happening with your energy mix in real-time. Really satisfying watching those solar panels kick in on the dashboard, not gonna lie. You'll spot which renewable sources are slacking and figure out the best times to switch between grid power and your clean energy. The consumption patterns become super clear too. Best part? You're cutting costs by using more of your own renewable power, plus you've got the data to show off your sustainability wins to whoever needs to see it.
Honestly, UI design can make or break these energy monitoring systems. People won't touch it if the dashboard looks like a spreadsheet threw up everywhere. Keep the main metrics front and center - make them actually readable at a glance. I've watched companies blow serious money on systems that just dump raw data with zero context. Nobody wants to decode that mess. Your design needs consistent patterns and easy drilling down into specifics. Oh, and don't overthink the colors or whatever. Simple beats fancy every time. Seriously though, get the UX right from day one or you'll have an expensive paperweight.
Honestly, the whole AI thing is going to flip these systems upside down. Predictive analytics will catch equipment problems way before they break - which is actually pretty sweet. Everything's getting connected now too, like your HVAC talking to individual light bulbs through IoT. Real-time data won't cost extra anymore, it'll just be standard. Edge computing processes stuff locally so responses happen instantly. Oh, and blockchain might handle energy trading between buildings (still sounds weird to me but whatever). My advice? Get systems now that play nice with multiple data sources. Makes upgrades way less painful down the road.
-
Top Quality presentations that are easily editable.