

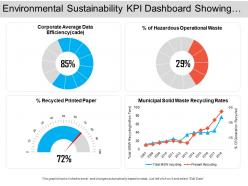
Environmental sustainability kpi dashboard showing corporate average data efficiency





Try Before you Buy Download Free Sample Product
 Impress Your
Audience
 100%
Editable
 Save Hours
of Time


Walk the red carpet with our Environmental Sustainability Kpi Dashboard Showing Corporate Average Data Efficiency. Your designer views will get a great reception.
People who downloaded this PowerPoint presentation also viewed the following :
Environmental sustainability kpi dashboard showing corporate average data efficiency with all 6 slides:
Folks experience immense bliss due to our Environmental Sustainability Kpi Dashboard Showing Corporate Average Data Efficiency. Hearts will burst with joy.


FAQs for Environmental sustainability kpi dashboard showing corporate
Key environmental sustainability KPIs include carbon footprint reduction, energy efficiency ratios, waste diversion rates, water consumption metrics, renewable energy adoption percentages, and regulatory compliance scores. These indicators streamline environmental reporting by tracking resource optimization, cost reduction, and sustainability goals, with many organizations finding that comprehensive dashboards ultimately deliver enhanced transparency, improved stakeholder confidence, and competitive advantage in increasingly eco-conscious markets.
Organizations measure carbon footprint effectively through KPI dashboards by tracking Scope 1, 2, and 3 emissions, energy consumption per unit, waste reduction percentages, and renewable energy adoption rates. These dashboards streamline sustainability reporting by consolidating data from manufacturing, transportation, and facilities management, with many companies finding that real-time carbon monitoring delivers enhanced regulatory compliance and competitive advantage.
Stakeholder engagement ensures sustainability KPIs reflect diverse priorities including investors, customers, employees, regulators, and communities, creating comprehensive metrics that address material environmental impacts. Through collaborative workshops, surveys, and consultations, organizations identify relevant indicators like carbon reduction, waste diversion, and water efficiency, ultimately delivering transparency and accountability that strengthens stakeholder relationships while driving meaningful environmental progress.
Comparative metrics enhance environmental sustainability dashboards by enabling benchmarking against industry standards, historical performance, and competitor achievements, while providing context for progress evaluation. These comparisons allow organizations to identify improvement opportunities, set realistic targets, and demonstrate meaningful environmental impact to stakeholders, ultimately driving better resource allocation and strategic sustainability decisions across operations.
Environmental sustainability KPI dashboard best practices include using color-coded heat maps for emissions tracking, trend line charts for resource consumption patterns, comparative bar charts for goal progress, and geographic visualizations for location-based metrics. These visualization approaches enhance stakeholder understanding by presenting complex sustainability data clearly, enabling faster decision-making for environmental initiatives, and ultimately delivering improved transparency and accountability across organizations.
Organizations ensure sustainability KPI data accuracy through automated data collection systems, regular third-party audits, standardized measurement protocols, blockchain-based tracking, and cross-functional verification processes. These approaches streamline data validation by eliminating manual errors, enhancing transparency, and enabling real-time monitoring, with many companies finding that integrated platforms deliver consistent reporting standards and stakeholder confidence in their environmental commitments.
Emerging environmental sustainability metrics include scope 3 emissions tracking, biodiversity impact assessments, circular economy indicators, water stress measurements, and social equity integration within environmental frameworks. These comprehensive metrics enable organizations to measure supply chain impacts, resource efficiency, and stakeholder value creation, with many companies finding that advanced sustainability dashboards deliver competitive advantages while meeting increasingly stringent regulatory requirements.
Businesses can align sustainability goals with KPIs by mapping specific objectives to measurable metrics like carbon footprint reduction, energy consumption per unit, waste diversion rates, water usage efficiency, and renewable energy adoption percentages. These dashboards enable organizations to track progress systematically, identify improvement opportunities, and demonstrate environmental accountability to stakeholders, while ultimately delivering operational cost savings and enhanced competitive positioning in increasingly sustainability-focused markets.
Real-time data integration significantly enhances environmental sustainability KPI dashboards by enabling immediate detection of performance deviations, automated alert systems, and dynamic resource allocation adjustments. Through continuous monitoring, organizations can rapidly respond to emission spikes, energy consumption anomalies, and waste management issues, while streamlining compliance reporting and ultimately delivering proactive environmental management and competitive sustainability advantages.
**INPUT**: What are the challenges in selecting the right KPIs for measuring water usage and conservation? **OUTPUT**: Selecting water conservation KPIs presents challenges including inconsistent measurement standards, varying baseline data quality, complex multi-facility tracking, and balancing operational versus environmental metrics. These complexities require strategic integration of usage intensity ratios, recycling rates, and cost-per-gallon saved, with manufacturing and hospitality organizations finding that standardized dashboards ultimately streamline reporting while delivering measurable sustainability outcomes. [Word count: 58 words]
Companies leverage KPI dashboards to communicate sustainability efforts through transparent data visualization, real-time progress tracking, automated reporting to investors, and customer-facing sustainability scorecards. These dashboards streamline stakeholder engagement by showcasing measurable environmental impact, carbon reduction milestones, and ESG compliance metrics, ultimately delivering enhanced brand credibility and competitive advantage in increasingly sustainability-conscious markets.
Setting long-term environmental sustainability goals establishes strategic vision and comprehensive transformation targets, while short-term goals enable incremental progress tracking, immediate accountability, and momentum building. This balanced approach allows organizations to pursue ambitious sustainability objectives through measurable quarterly milestones, with many companies finding that combining 10-year carbon neutrality targets with annual reduction benchmarks delivers both stakeholder confidence and operational focus.
Artificial intelligence and machine learning enhance environmental KPI tracking by automating data collection, predicting trends through pattern recognition, and identifying optimization opportunities across operations. These technologies streamline sustainability reporting by processing real-time emissions data, energy consumption patterns, and resource usage metrics, ultimately delivering more accurate environmental insights and enabling organizations to achieve sustainability targets faster while reducing operational costs.
Regulatory requirements significantly influence sustainability KPI selection by mandating specific metrics like carbon emissions, waste reduction, water usage, and energy efficiency across industries. Organizations in sectors such as manufacturing, energy, and finance increasingly align their dashboards with frameworks like EU taxonomy and SEC climate disclosures, ultimately ensuring compliance while enhancing operational transparency and competitive positioning.
Organizations benchmark sustainability performance by comparing their KPIs against industry databases, participating in peer networks, utilizing third-party benchmarking platforms, and engaging with sustainability reporting frameworks like CDP and GRI. Through these strategic approaches, companies in manufacturing, retail, and financial services identify performance gaps, set competitive targets, and accelerate their environmental initiatives, ultimately delivering enhanced stakeholder value and market positioning.
-
Informative design.
-
Best Representation of topics, really appreciable.