

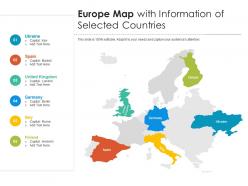
Europe map with information of selected countries





Try Before you Buy Download Free Sample Product
 Impress Your
Audience
 100%
Editable
 Save Hours
of Time


Our Europe Map With Information Of Selected Countries are topically designed to provide an attractive backdrop to any subject. Use them to look like a presentation pro.
People who downloaded this PowerPoint presentation also viewed the following :
Europe map with information of selected countries with all 2 slides:
Use our Europe Map With Information Of Selected Countries to effectively help you save your valuable time. They are readymade to fit into any presentation structure.

FAQs for Europe map with information
Key elements include accurate geographical boundaries, strategic color coding for data visualization, clear legends and labels, demographic or economic indicators, and interactive features when digital. These components enhance comprehension by highlighting regional patterns, economic trends, and cultural distinctions across European nations, with many organizations finding that well-designed map infographics significantly improve audience engagement and data retention.
Color schemes significantly impact Europe map infographic engagement by enhancing visual hierarchy, improving data comprehension, and creating emotional connections with viewers. Strategic color choices help distinguish between countries, highlight key data patterns, and guide audience attention, while culturally appropriate palettes resonate with European audiences, ultimately delivering clearer communication and increased viewer retention across presentations.
Europe map infographics commonly represent economic data, demographic statistics, political indicators, healthcare metrics, and environmental information because these datasets effectively showcase regional variations across the continent. Financial services organizations, healthcare institutions, and government agencies find that visualizing trade volumes, population densities, election results, and climate data through geographic mapping enhances stakeholder understanding while delivering clearer insights for strategic decision-making.
Cultural contexts across Europe significantly influence map infographic design through language considerations, color symbolism, historical sensitivities, and regional visual preferences. Nordic countries often favor minimalist approaches, while Mediterranean regions embrace warmer color palettes and detailed imagery, with many organizations finding that culturally-adapted designs enhance audience engagement and comprehension across diverse European markets.
Effective annotation methods for Europe map infographics include color-coded legends, strategic callout boxes, data overlays, clear typography hierarchies, and interactive hover elements. These techniques enhance comprehension by highlighting regional patterns, providing contextual information, and guiding viewer attention, with many organizations finding that well-annotated maps increase audience engagement and data retention significantly.
Dynamic elements can be integrated through clickable regions, hover effects, animated data visualizations, pop-up information panels, and interactive legends that reveal country-specific statistics or trends. These features enhance audience engagement by enabling real-time exploration of European market data, demographic insights, or regional performance metrics, ultimately delivering more impactful presentations and deeper stakeholder understanding.
Common pitfalls include using outdated country boundaries, poor color contrast that reduces readability, overcrowding with excessive data points, ignoring cultural sensitivities in regional representations, and selecting inappropriate map projections. These issues undermine credibility and user engagement, with many organizations finding that thorough research, clear visual hierarchy, and cultural awareness ultimately deliver more effective communication and stronger audience trust.
Europe infographics can be tailored through targeted data selection, culturally relevant design elements, appropriate language localization, and audience-specific visual hierarchies that emphasize relevant regional insights. By customizing color schemes, incorporating familiar landmarks, adjusting complexity levels, and highlighting sector-specific metrics, organizations successfully enhance audience engagement and comprehension, with many finding that localized approaches deliver significantly higher information retention and stakeholder buy-in.
**INPUT**: What tools or software are recommended for designing high-quality Europe map infographics? **OUTPUT**: Recommended tools include Adobe Illustrator, Canva Pro, Tableau, ArcGIS, and specialized platforms like Infogram and Venngage. These applications streamline map creation by offering customizable templates, data integration capabilities, and professional styling options, with many marketing teams and research organizations finding that vector-based tools deliver scalable graphics for presentations, reports, and digital campaigns.
Balancing aesthetics and information density requires strategic layering, selective color coding, clear typography hierarchy, and purposeful white space management. Effective Europe map infographics use visual clustering for related data points, implement progressive disclosure techniques, and maintain consistent design elements, with many designers finding that prioritizing key insights over comprehensive data coverage ultimately delivers stronger audience engagement and information retention.
Symbols and icons streamline complex geographical, economic, and demographic data by replacing lengthy text with universally recognizable visual elements, creating intuitive navigation pathways, and establishing clear categorical distinctions across regions. Through strategic iconography, organizations present population densities, trade routes, and cultural landmarks efficiently, with many European institutions finding that symbolic representation enhances audience comprehension while delivering faster information processing and broader accessibility.
Historical data can be effectively portrayed in Europe map infographics through color-coded timelines, layered visual elements, interactive hotspots, comparative before-and-after views, and strategic use of symbols or icons. These design approaches enable organizations to present complex historical narratives by combining geographical context with temporal progression, ultimately delivering enhanced comprehension and engagement for educational institutions, museums, and research organizations seeking compelling data visualization.
Current trends in Europe map infographic design include interactive data layers, real-time integration capabilities, mobile-responsive layouts, color-coded regional analytics, and customizable visualization filters. These design approaches streamline complex European data presentation by enhancing user engagement, improving accessibility across devices, and enabling dynamic storytelling, with many organizations finding that modern map infographics deliver stronger audience retention and clearer insights.
Infographics can illustrate geopolitical changes through animated timelines, comparative maps, and data visualizations that track border shifts, EU expansions, economic indicators, and political alliances across decades. These visual tools enable organizations, educational institutions, and policy analysts to communicate complex European transformations effectively, while government agencies and research bodies find that interactive formats enhance stakeholder understanding and strategic decision-making.
Best practices for sourcing data in Europe map infographics include using official statistical offices like Eurostat, national government databases, reputable research institutions, international organizations, and peer-reviewed publications. These sources enhance credibility by providing verified information, standardized methodologies, and transparent attribution, with many organizations finding that proper citations ultimately deliver audience trust and professional authority.
-
Content of slide is easy to understand and edit.
-
Informative presentations that are easily editable.
-
Attractive design and informative presentation.