


Evolving business intelligence infrastructure powerpoint presentation slides
The PowerPoint template is a valuable tool in presenting intelligence infrastructure to optimize assets through digitization and utilization of integrated technology solutions. The business transformation will allow the firm to enhance customer experience and optimize processes such as data center management, enhancing security standards, and improved operational capabilities. The template covers details regarding the current potential implications faced by the firm in terms of high IT infrastructure cost, service delay, service failure, issues related to employees, increased security threats, and data breaches. It portrays information regarding the challenges faced in the budget, lack of talent and expertise, absence of advanced tools. It caters to comparative analysis for checking the extent of existing infrastructure intelligence and technological assessment. The template covers information regarding the categories such as system, network, and storage management and components such as computer hardware and software applications, data management platforms involved in IT infrastructure management. It covers details about firms moving towards implementing intelligence infrastructure by determining dimensions for digitally advanced infrastructure, determining capabilities enabling intelligent infrastructure. The template covers details regarding workplace optimization such as intelligent automation at the workplace, enhancing operational capabilities by digitally transforming overall operational efficiency and enabling customer-centric transformation process, improved security standards by developing security center, how the firm will handle threats, incident management, data center management by addressing hyper-converged infrastructure and enhancing the value of information stored, optimizing network system with network management architecture, leveraging workforce involved by appointing Chief Technology Officer, staff training. It will cover the budget assessment of technology advancement to functional areas, impact assessment for successful infrastructure intelligence implementation, and dashboard analysis for intelligence activities and cyber security management. Feel free to talk to our experts and get access to the template now.
The PowerPoint template is a valuable tool in presenting intelligence infrastructure to optimize assets through digitizatio..





-

- Google Slides is a new FREE Presentation software from Google.
- All our content is 100% compatible with Google Slides.
- Just download our designs, and upload them to Google Slides and they will work automatically.
- Amaze your audience with SlideTeam and Google Slides.
-

Want Changes to This PPT Slide? Check out our Presentation Design Services
-

- WideScreen Aspect ratio is becoming a very popular format. When you download this product, the downloaded ZIP will contain this product in both standard and widescreen format.
-

- Some older products that we have may only be in standard format, but they can easily be converted to widescreen.
- To do this, please open the SlideTeam product in Powerpoint, and go to
- Design ( On the top bar) -> Page Setup -> and select "On-screen Show (16:9)” in the drop down for "Slides Sized for".
- The slide or theme will change to widescreen, and all graphics will adjust automatically. You can similarly convert our content to any other desired screen aspect ratio.
Compatible With Google Slides

Get This In WideScreen
You must be logged in to download this presentation.


Do you want to remove this product from your favourites?
PowerPoint presentation slides
Enthrall your audience with this Evolving Business Intelligence Infrastructure Powerpoint Presentation Slides. Increase your presentation threshold by deploying this well crafted template. It acts as a great communication tool due to its well researched content. It also contains stylized icons, graphics, visuals etc, which make it an immediate attention grabber. Comprising seventy one slides, this complete deck is all you need to get noticed. All the slides and their content can be altered to suit your unique business setting. Not only that, other components and graphics can also be modified to add personal touches to this prefabricated set.

People who downloaded this PowerPoint presentation also viewed the following :
Content of this Powerpoint Presentation
Slide 1: This slide displays the title i.e. 'Evolving Business Intelligence Infrastructure' and your Company Name.
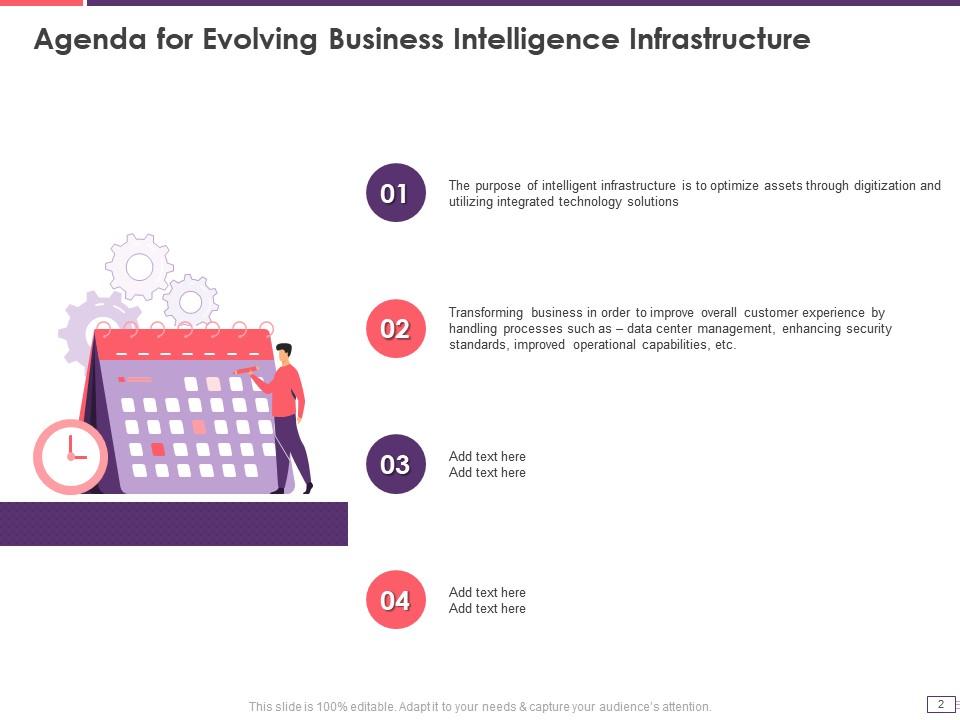
Slide 2: This slide presents the agenda for the project.
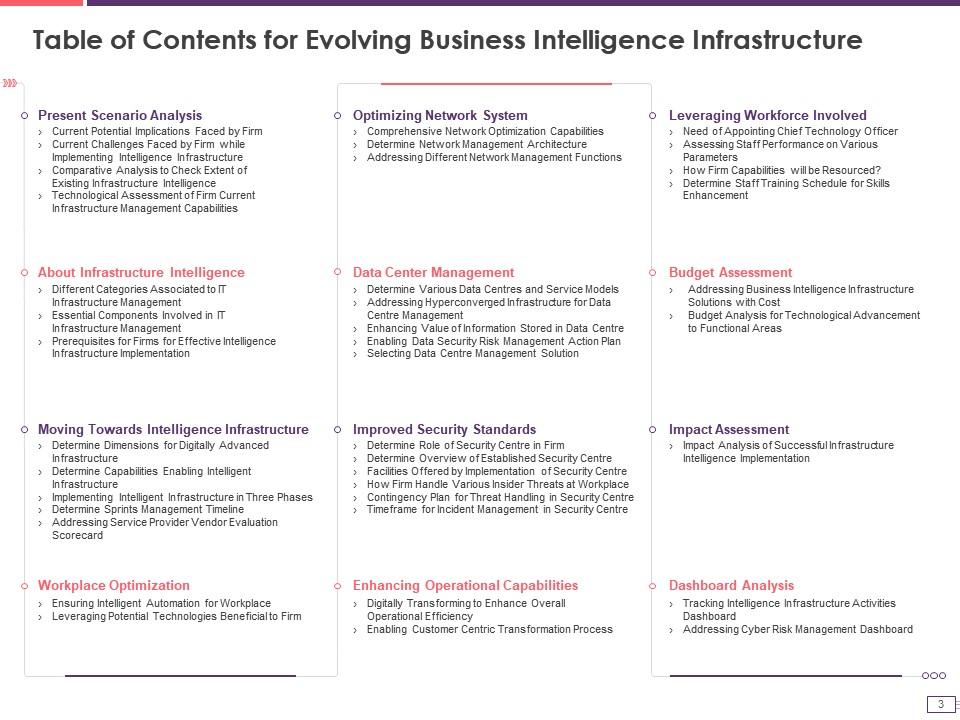
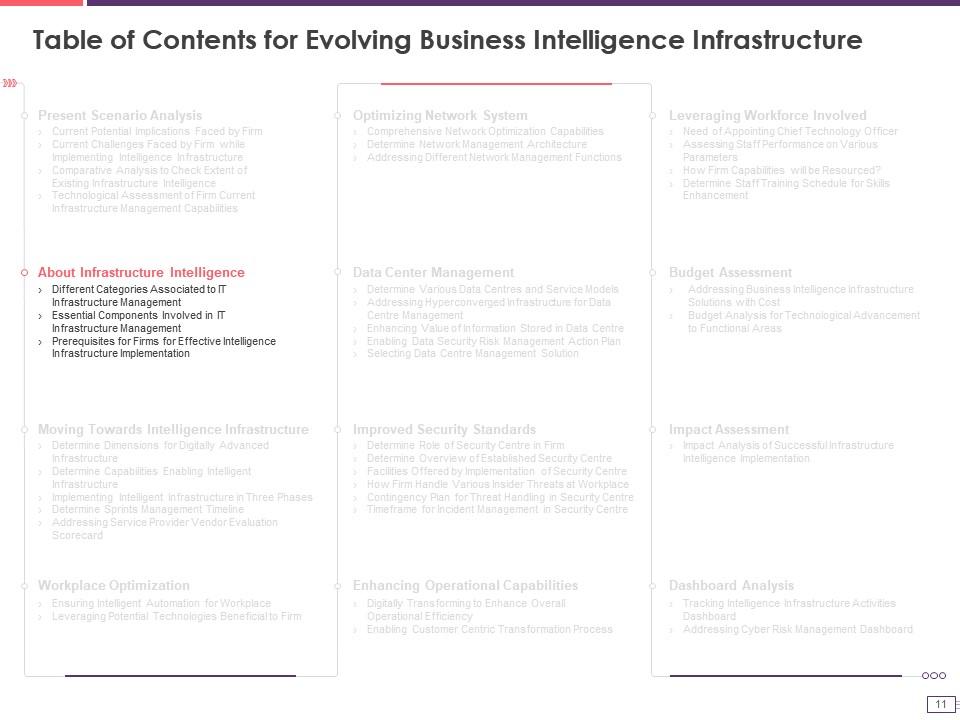
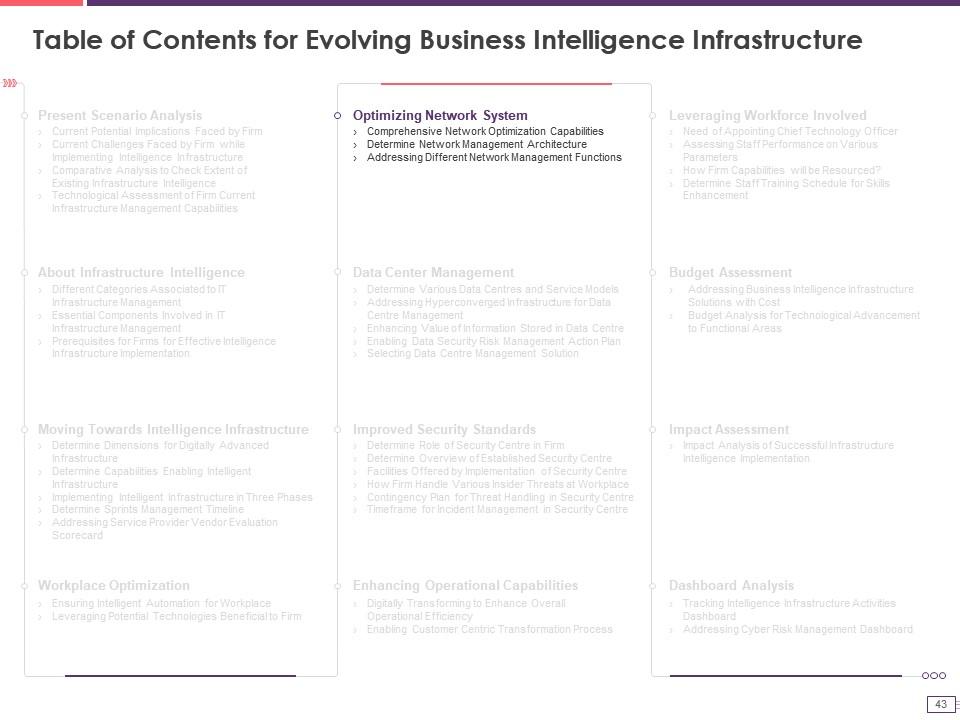
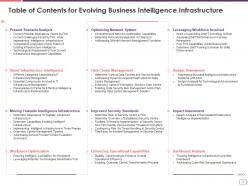
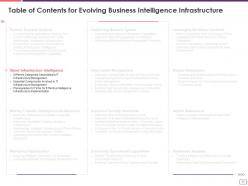
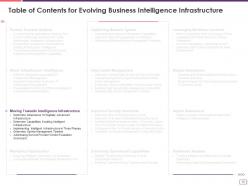
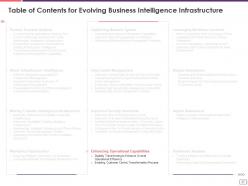
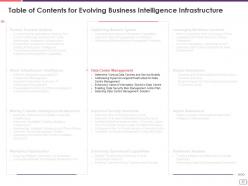
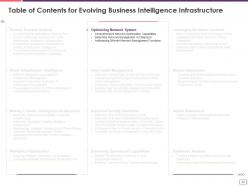
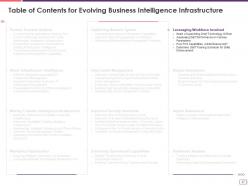
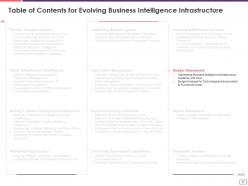
Slide 3: This slide presents the table of contents for the project.
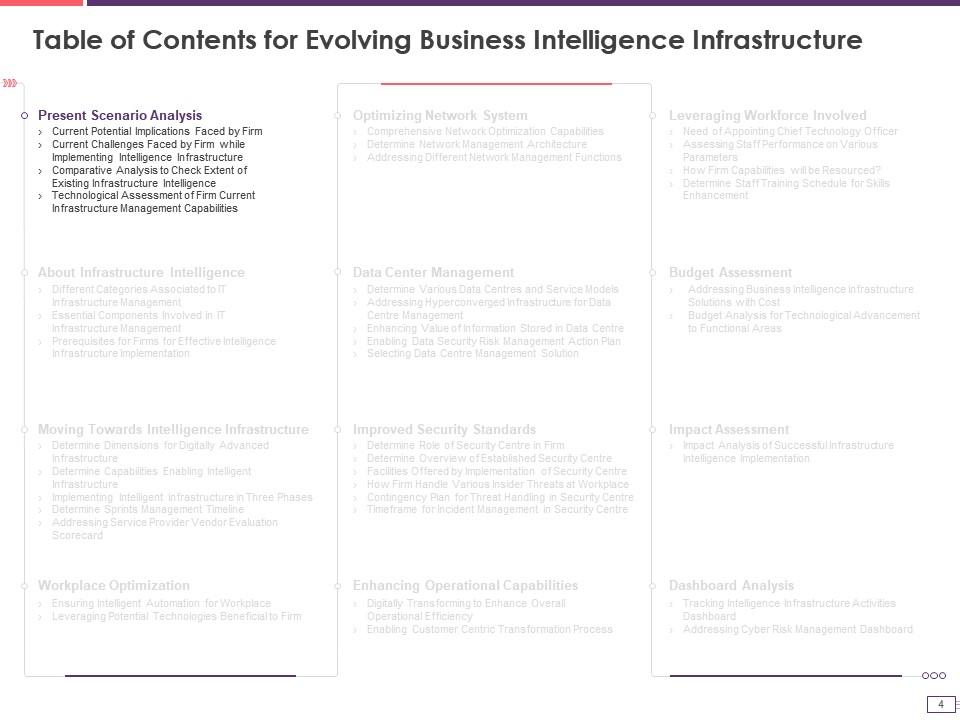
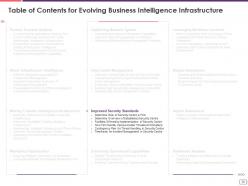
Slide 4: This slide exhibits the table of contents for the project.
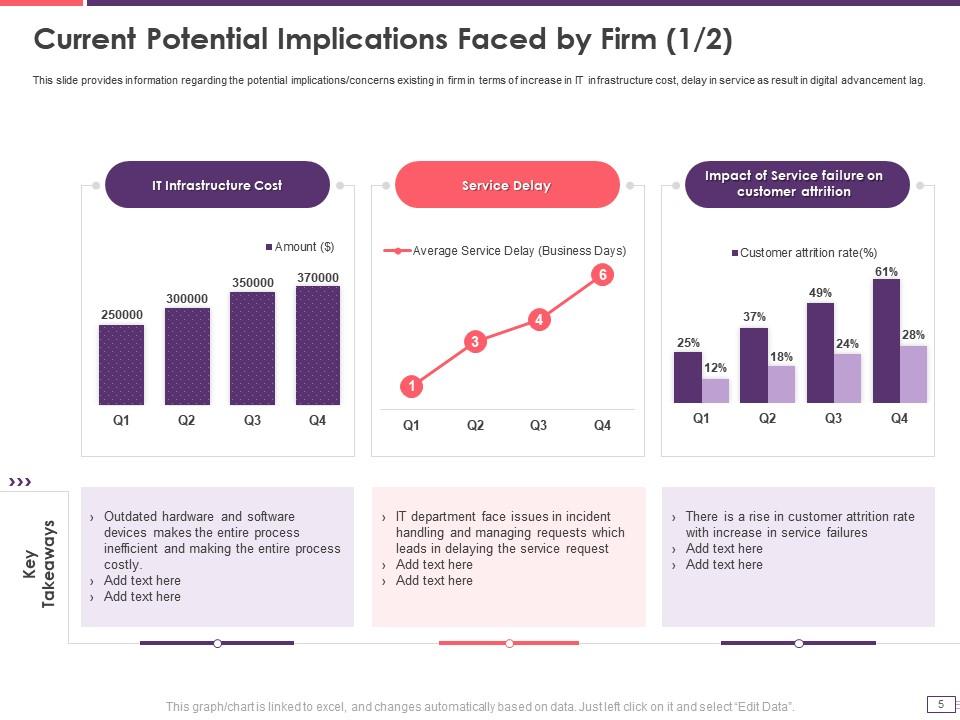
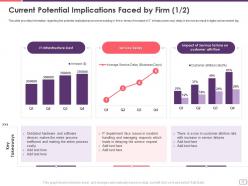
Slide 5: This slide explains the potential implications/concerns existing in firm in terms of increase in IT infrastructure cost, delay in service, etc.
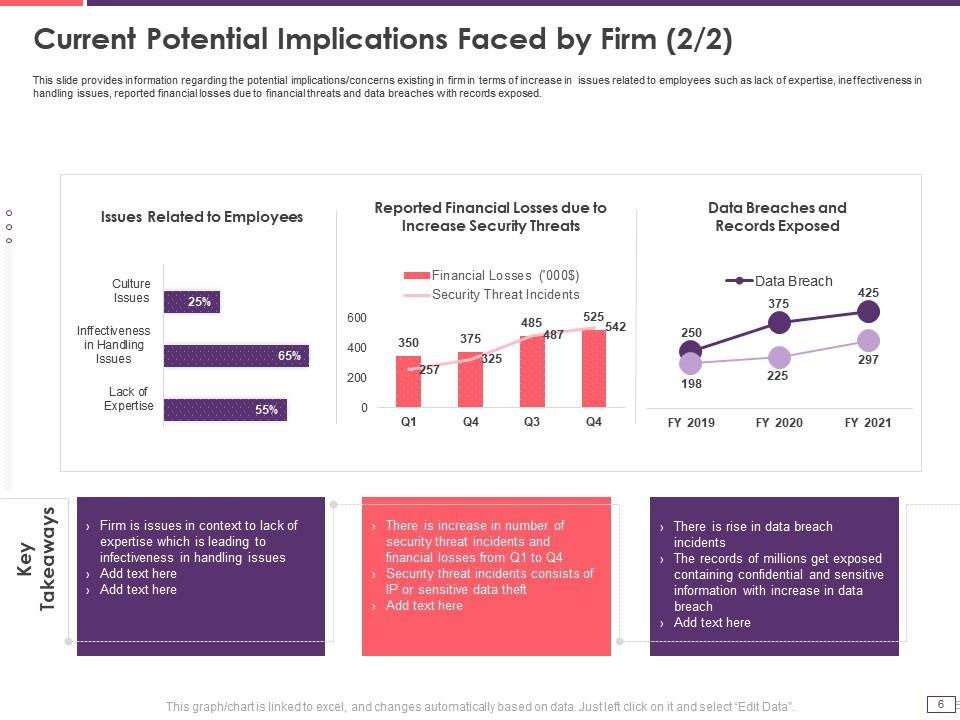
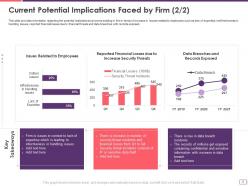
Slide 6: This slide displays potential implications/concerns existing in firm in terms of increase in issues related to employees such as lack of expertise, ineffectiveness in handling issues, etc.
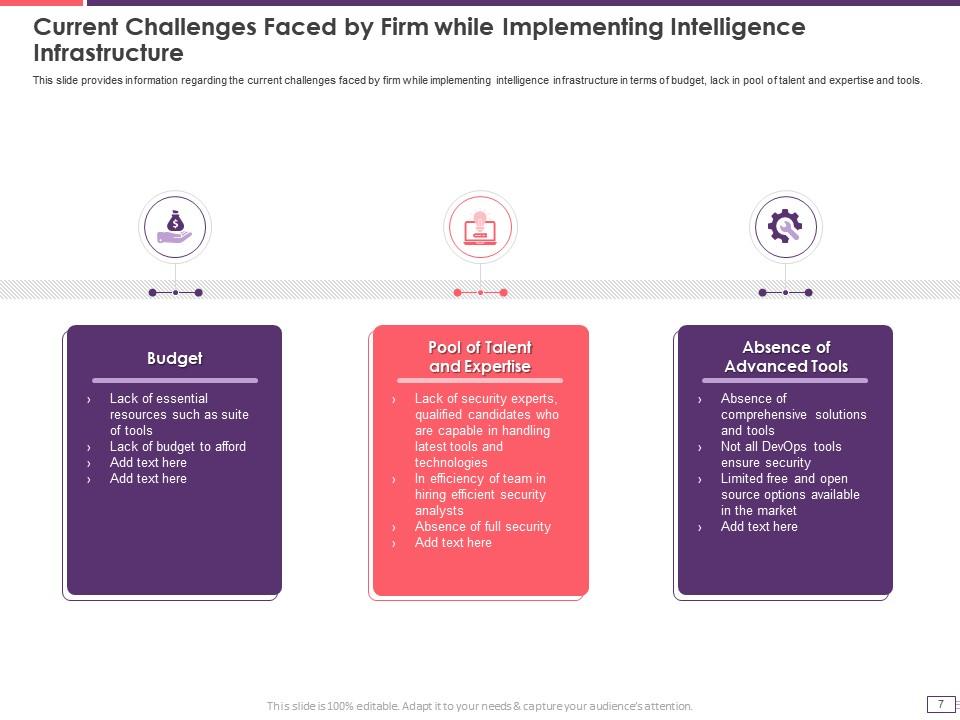
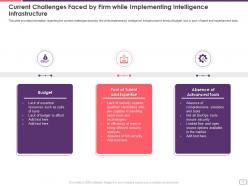
Slide 7: This slide showcases current challenges faced by firm while implementing intelligence infrastructure in terms of budget, lack in pool of talent and expertise and tools.
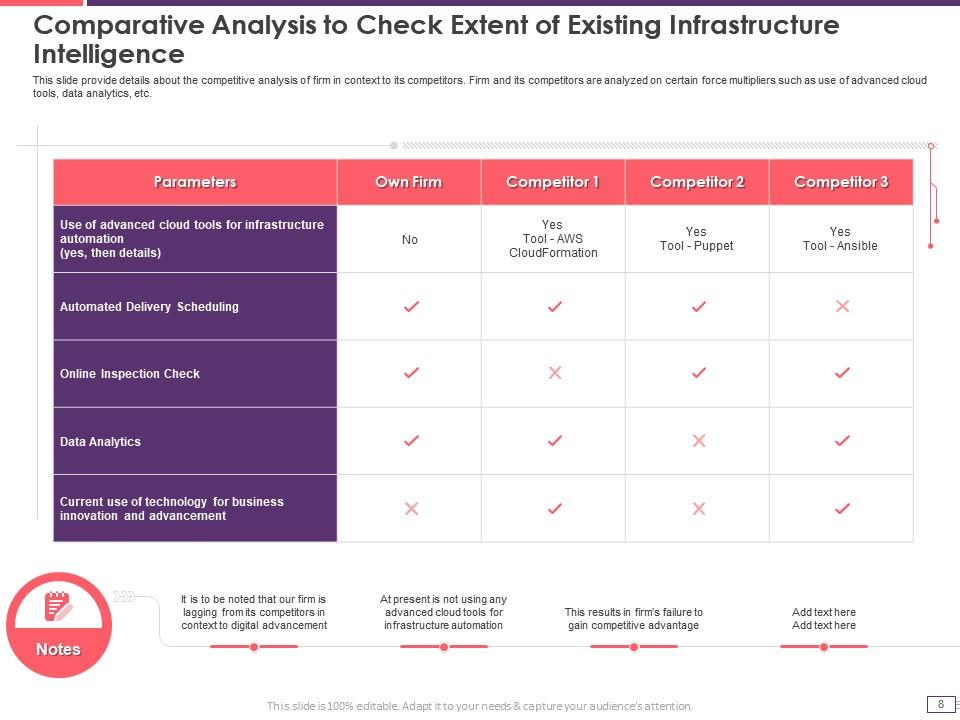
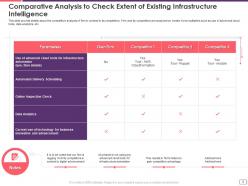
Slide 8: This slide pexplains competitive analysis of firm in context to its competitors.
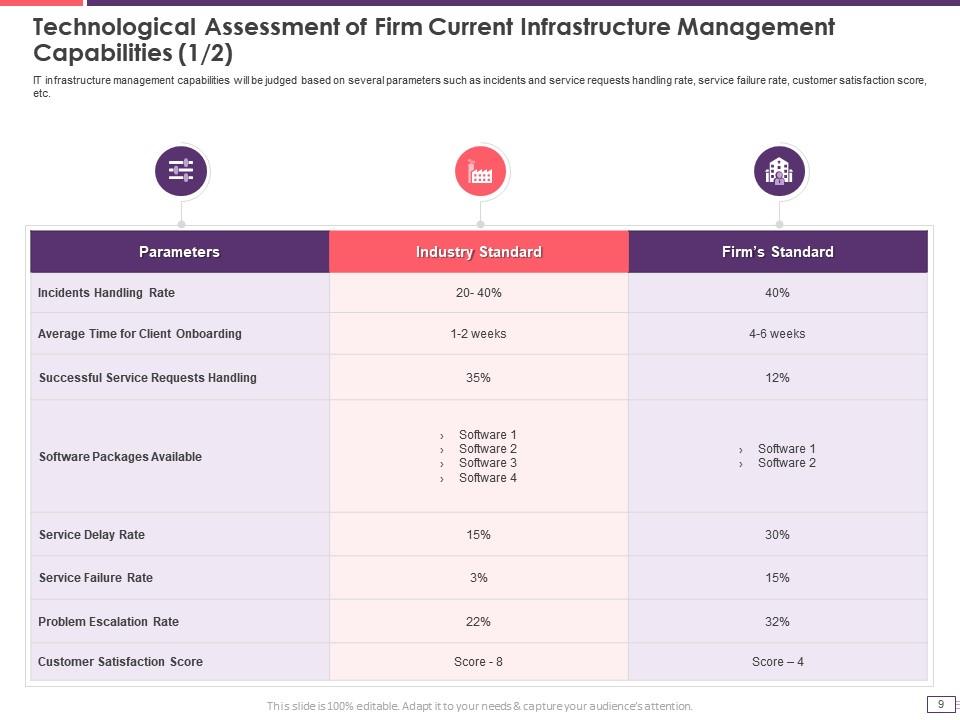
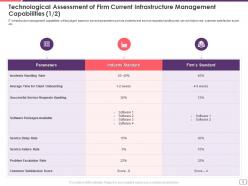
Slide 9: This slide displays the Technological Assessment of Firm Current Infrastructure Management Capabilities.
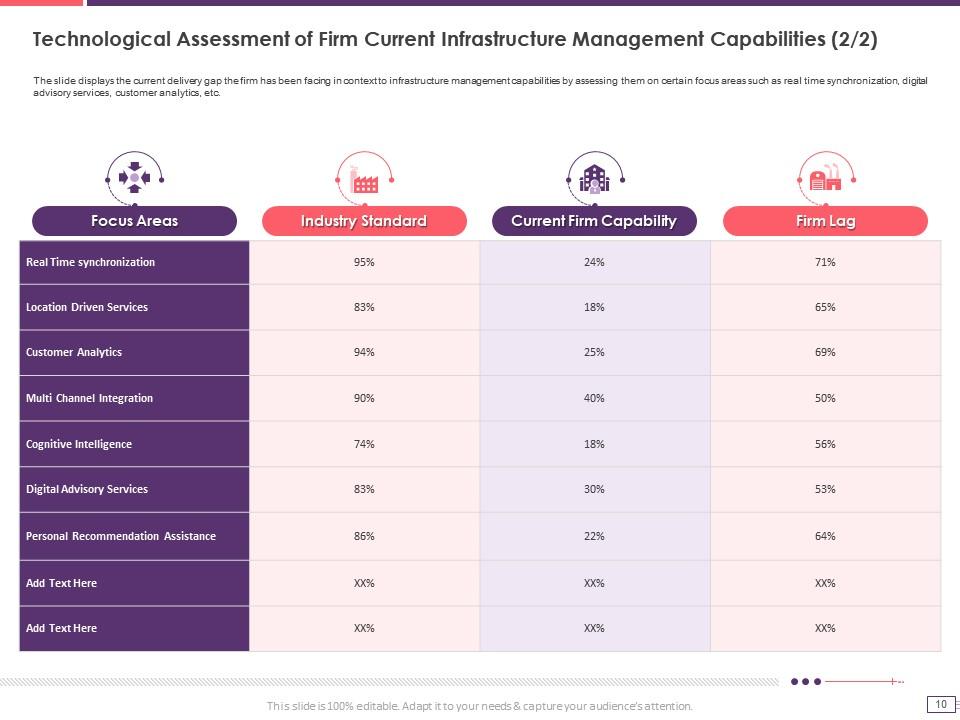
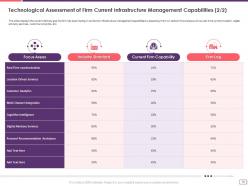
Slide 10: The slide displays the current delivery gap the firm has been facing in context to infrastructure management capabilities.
Slide 11: This slide exhibits the title for infrastructure intelligence.
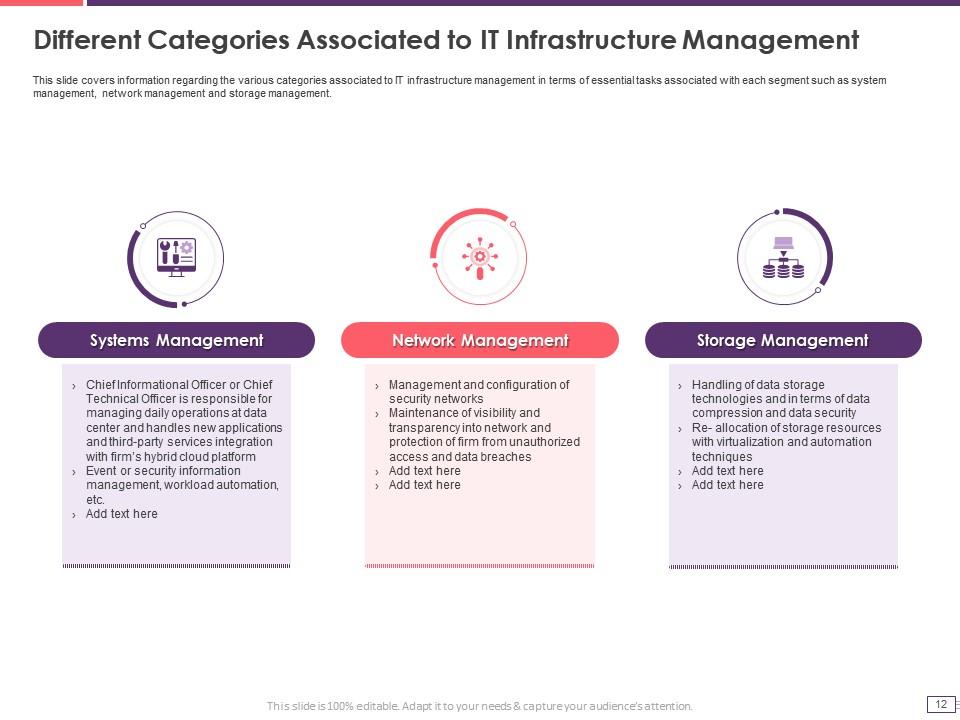
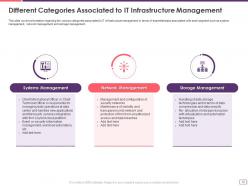
Slide 12: This slide covers information regarding the various categories associated to IT infrastructure management.
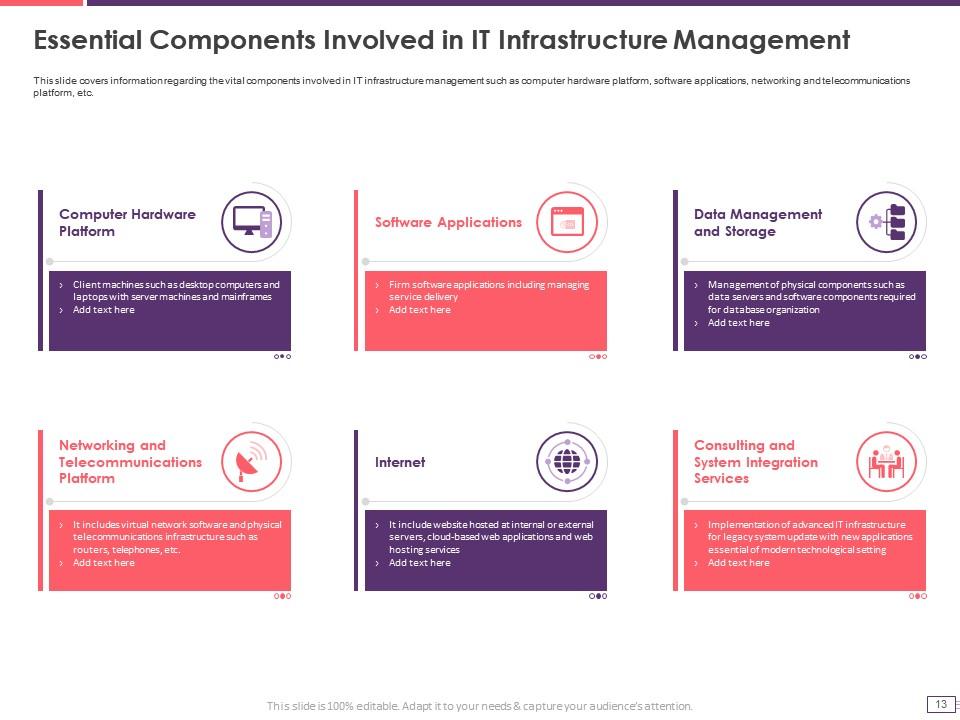
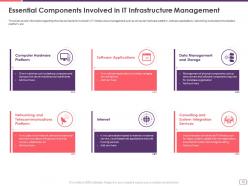
Slide 13: This slide covers information regarding the vital components involved in IT infrastructure management such as computer hardware platform, software applications, etc.
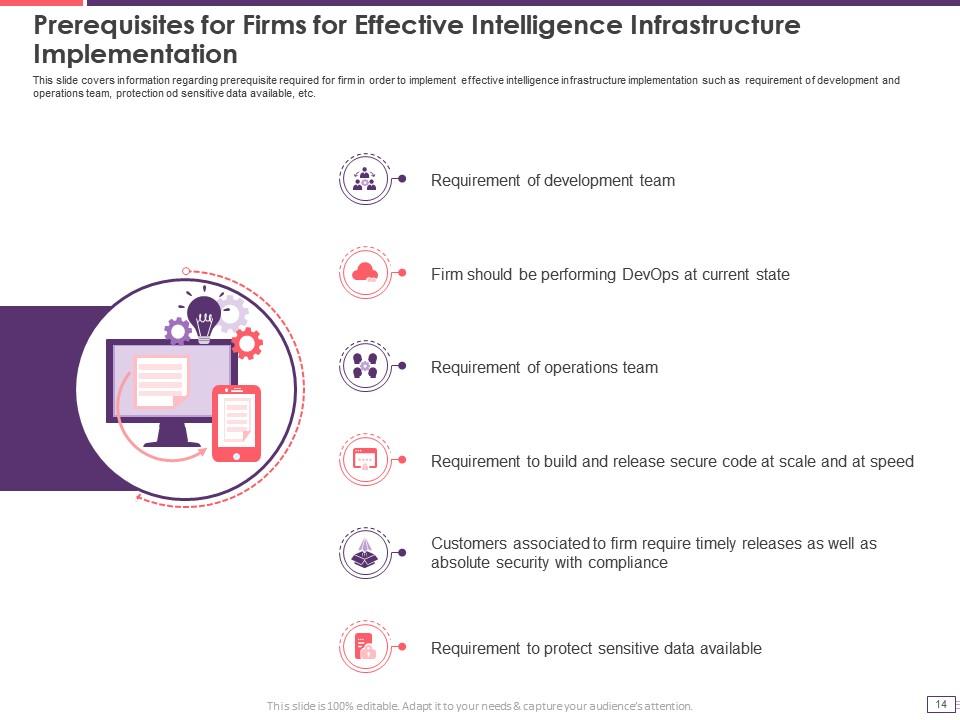
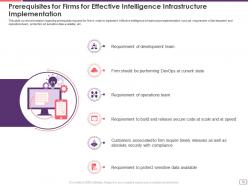
Slide 14: This slide covers information regarding prerequisite required for firm in order to implement effective intelligence infrastructure implementation.
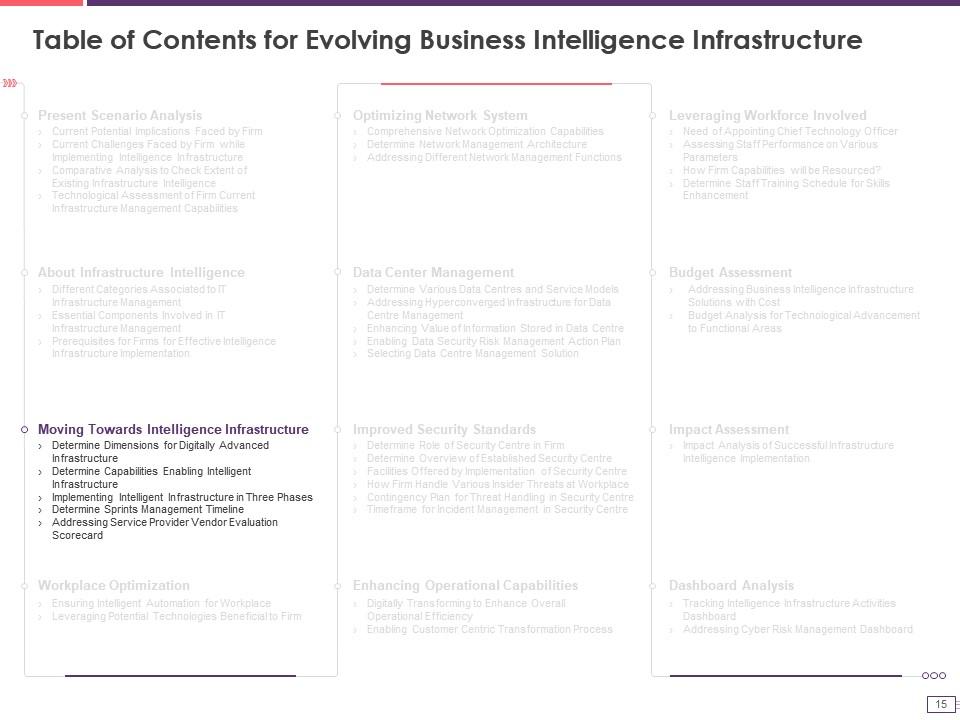
Slide 15: This slide displays the title for evolving business intelligence infrstructure.
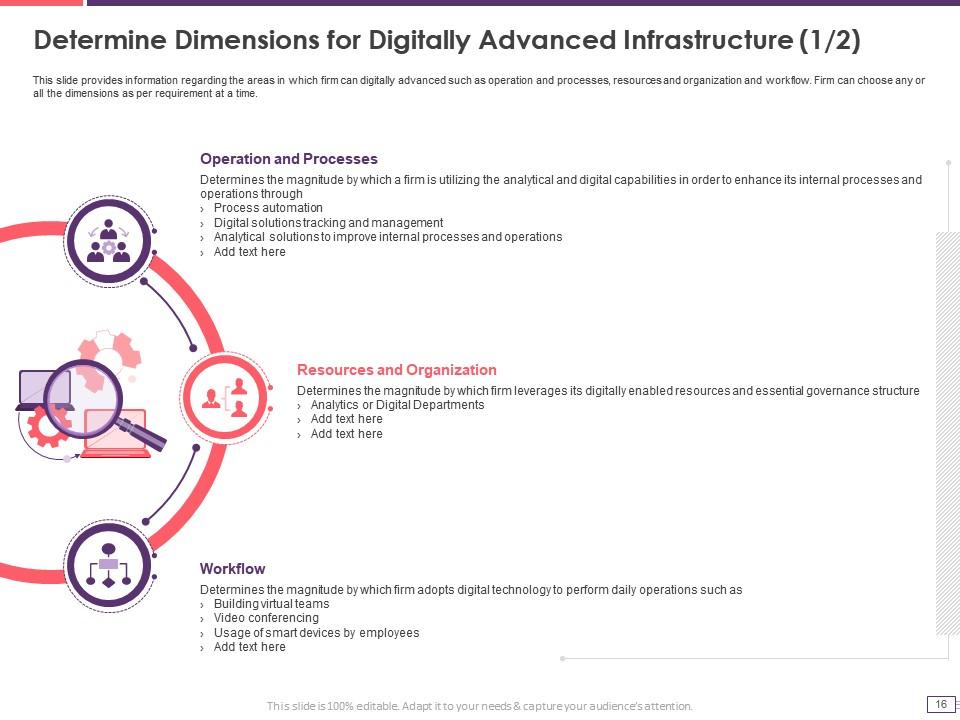
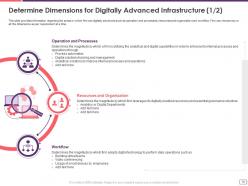
Slide 16: This slide provides information regarding the areas in which firm can digitally advanced such as operation and processes, resources and organization and workflow.
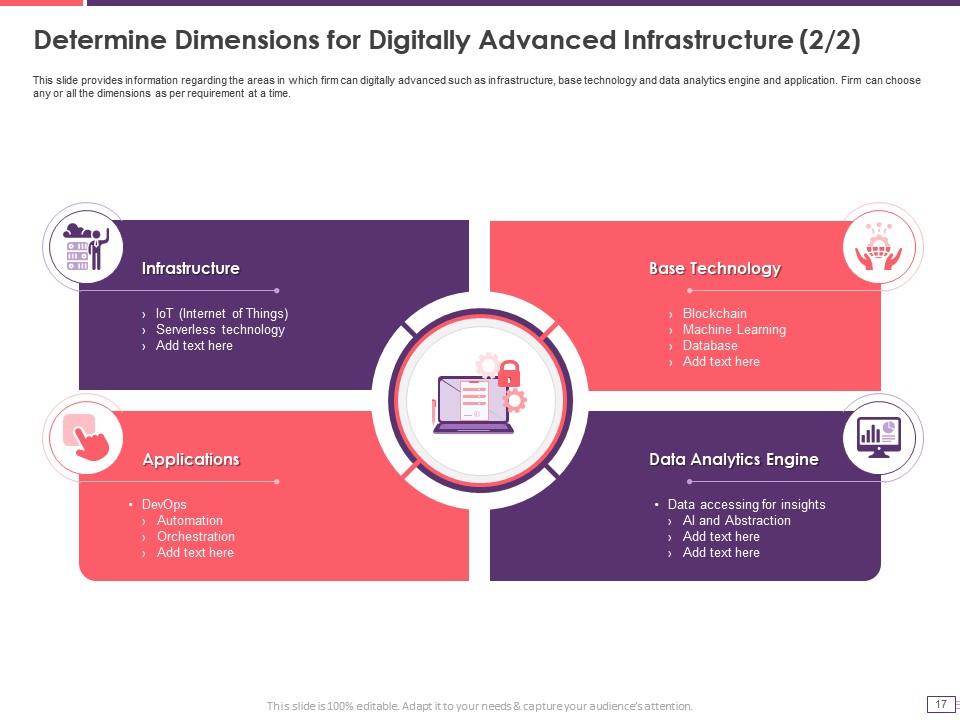
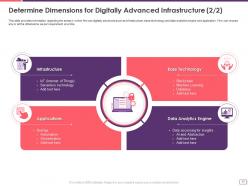
Slide 17: This slide explains areas in which firm can digitally advanced like infrastructure, base technology and data analytics engine and application.
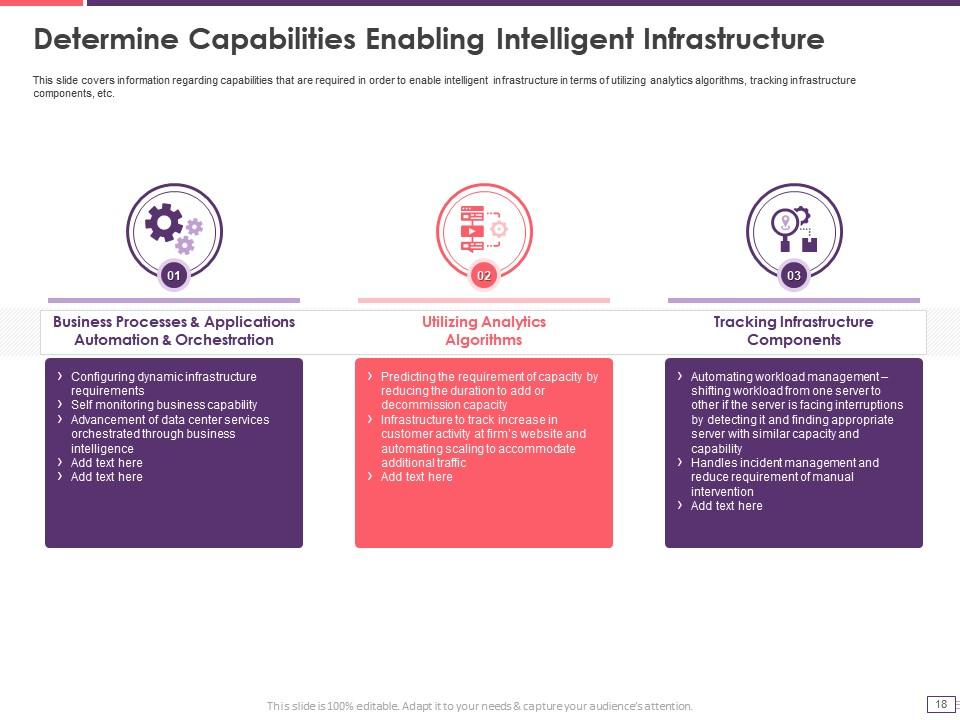
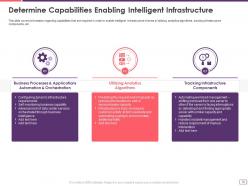
Slide 18: This slide covers information regarding capabilities that are required in order to enable intelligent infrastructure in terms of utilizing analytics algorithms, etc.
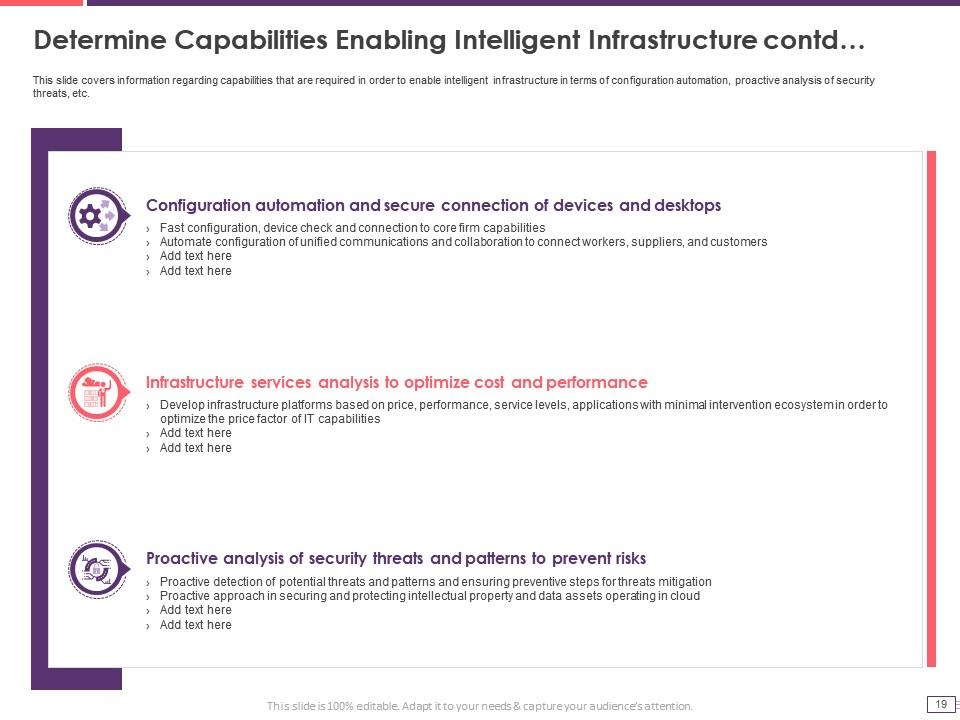
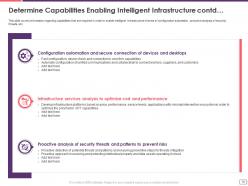
Slide 19: This slide presents capabilities that are required in order to enable intelligent infrastructure in terms of proactive analysis of security threats, etc.
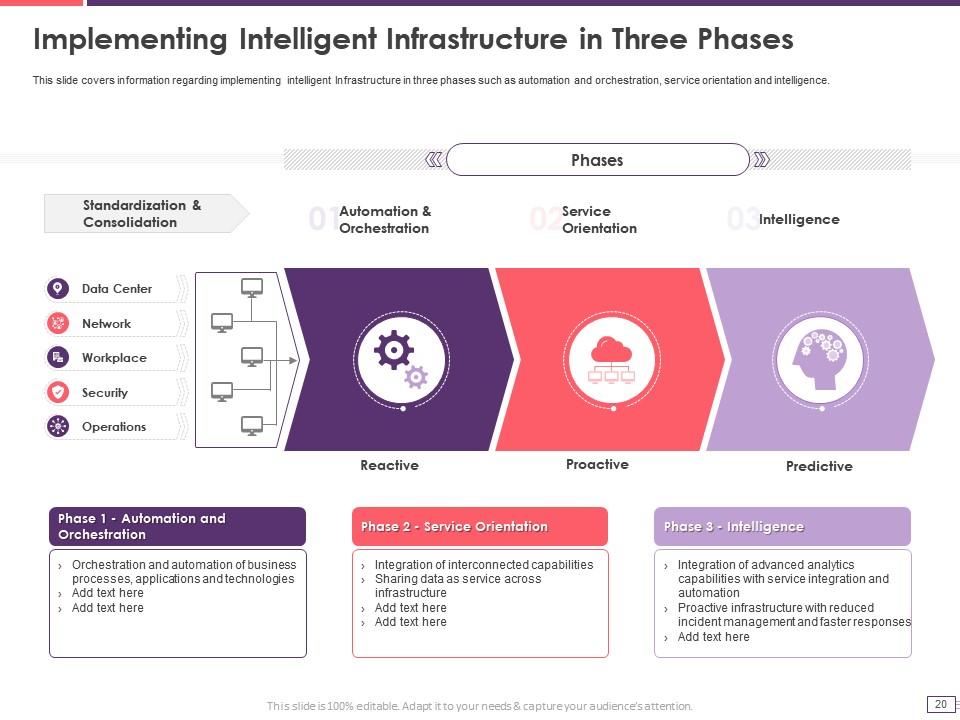
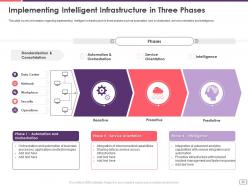
Slide 20: This slide exhibits implementing intelligent Infrastructure in three phases such as automation and orchestration, service orientation and intelligence.
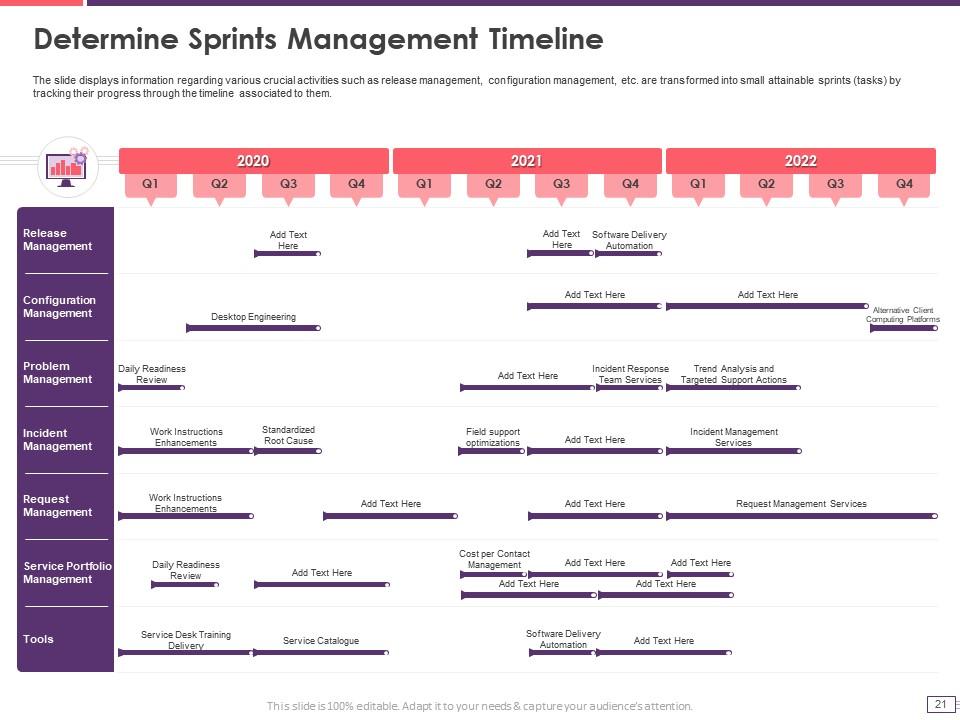
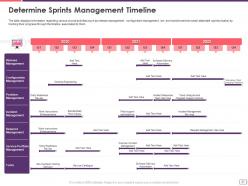
Slide 21: The slide displays information regarding various crucial activities such as release management, configuration management, etc.
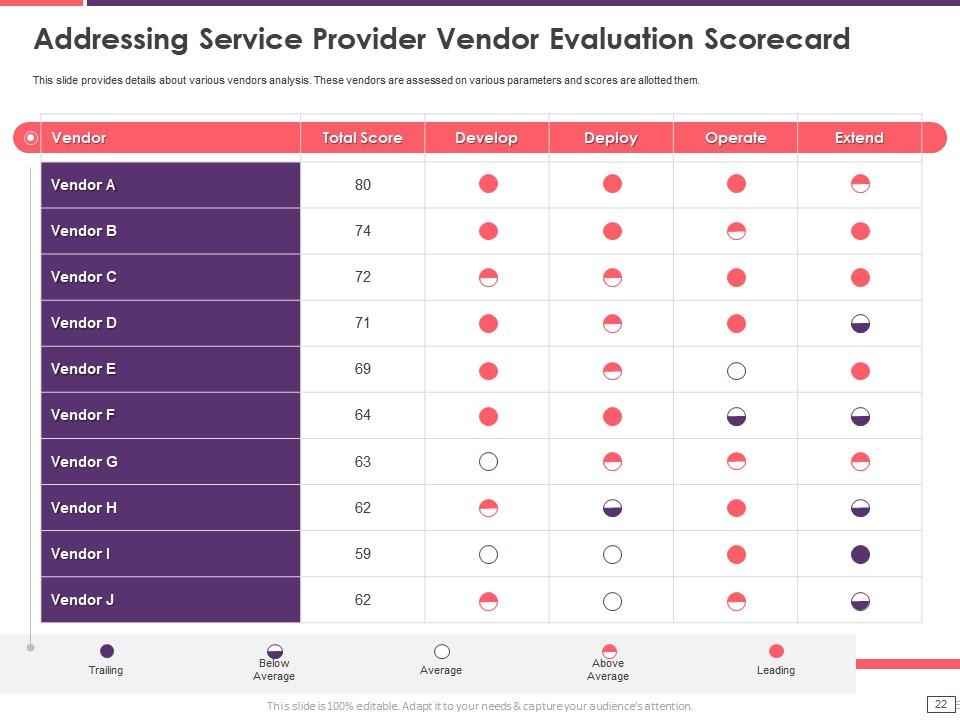
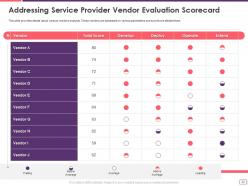
Slide 22: This slide provides details about various vendors analysis. These vendors are assessed on various parameters and scores are allotted them.
Slide 23: This slide displays the title for workplace optimization.
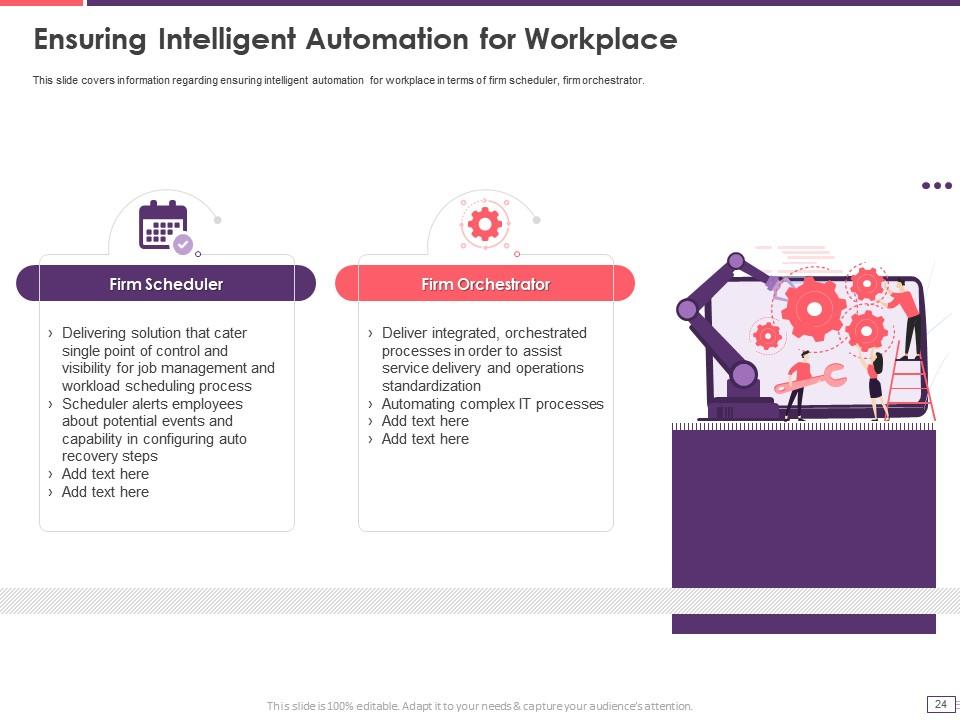
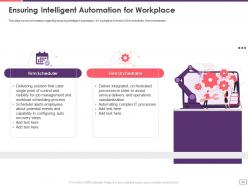
Slide 24: This slide covers information regarding ensuring intelligent automation for workplace in terms of firm scheduler, firm orchestrator.
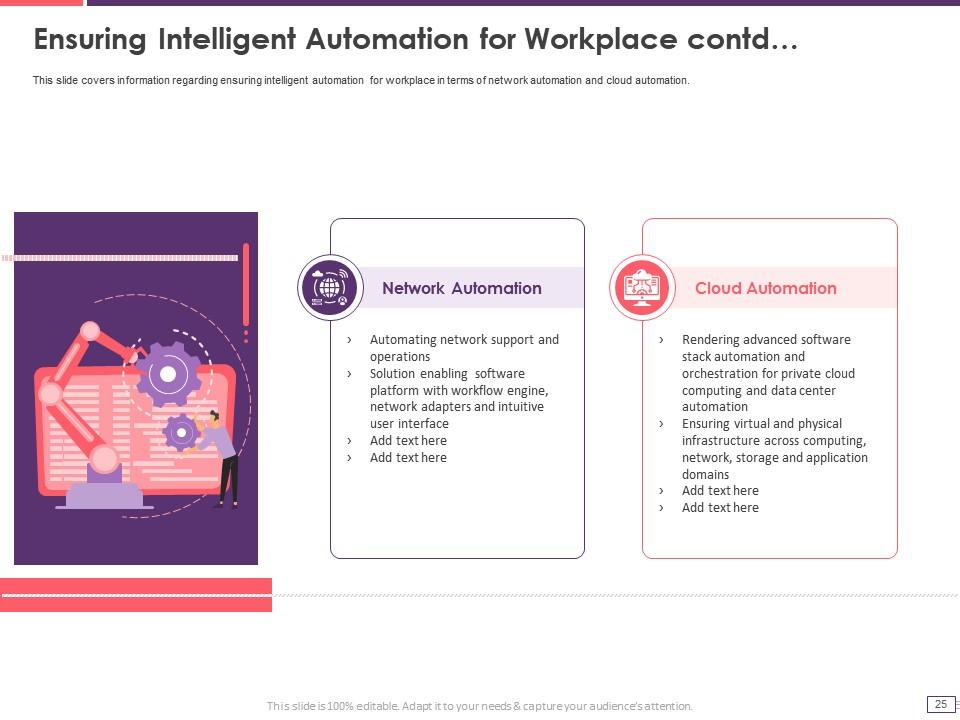
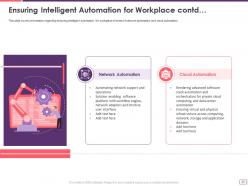
Slide 25: This slide covers information regarding ensuring intelligent automation for workplace in terms of network automation and cloud automation.
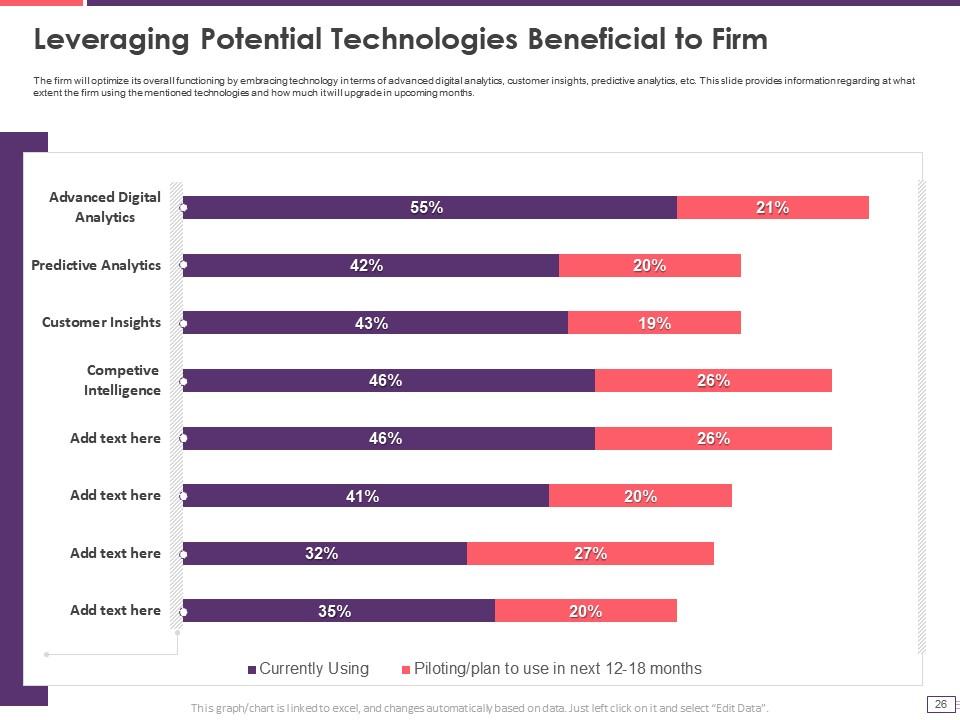
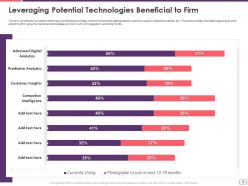
Slide 26: This slide provides information regarding at what extent the firm using the mentioned technologies and how much it will upgrade in upcoming months.
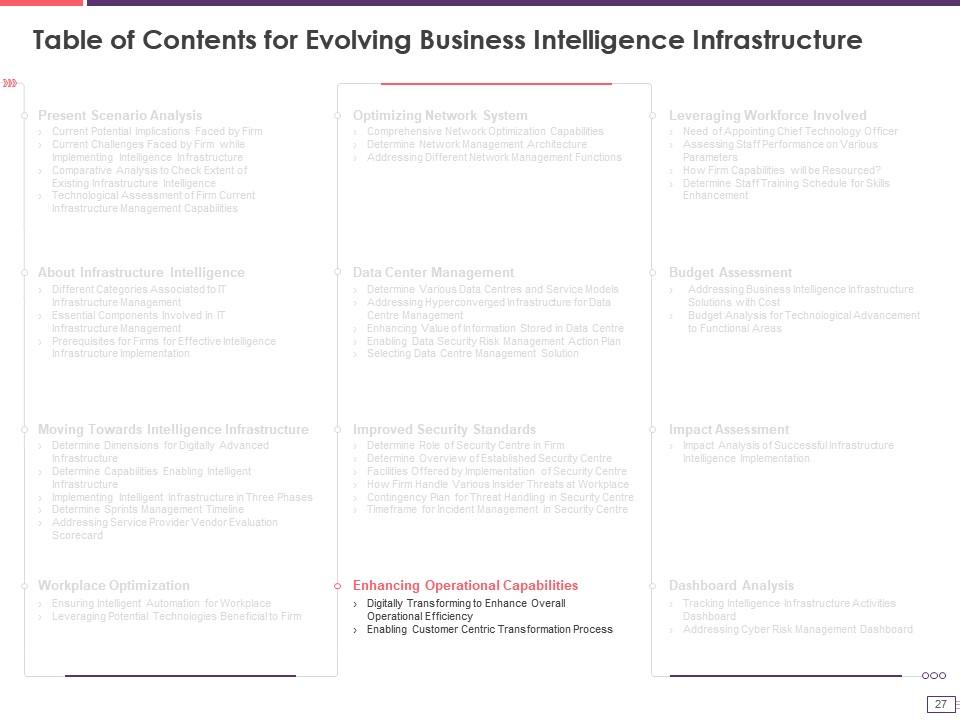
Slide 27: This slide exhibits the title for enhancing operational capabilities.
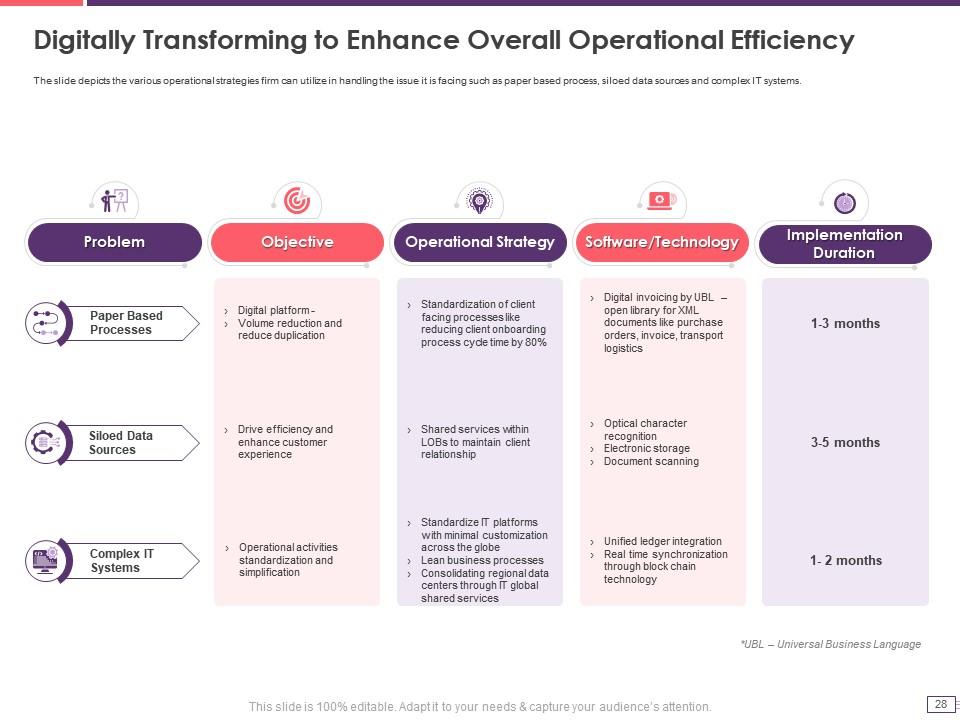
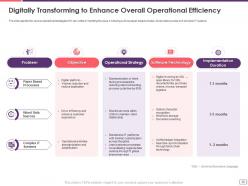
Slide 28: The slide depicts the various operational strategies firm can utilize in handling the issue it is facing such as paper based process, complex IT systems, etc.
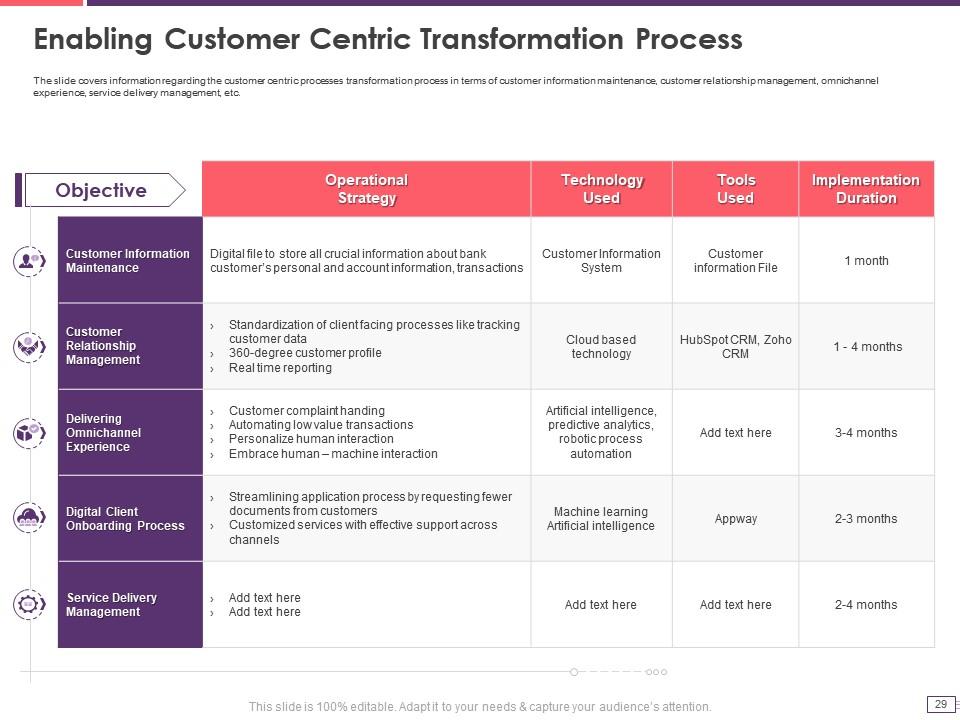
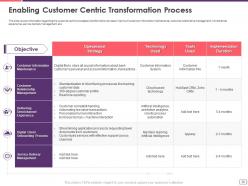
Slide 29: The slide covers information regarding the customer centric processes transformation process in terms of customer information maintenance, omnichannel experience, etc.
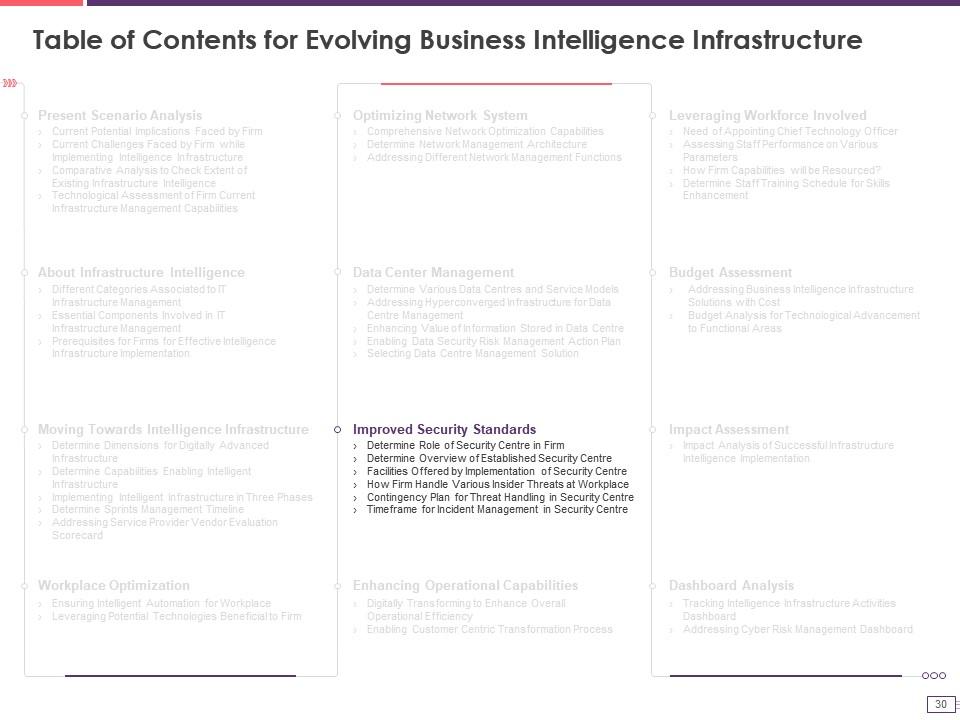
Slide 30: This slide displays the title for Improved Security Standards.
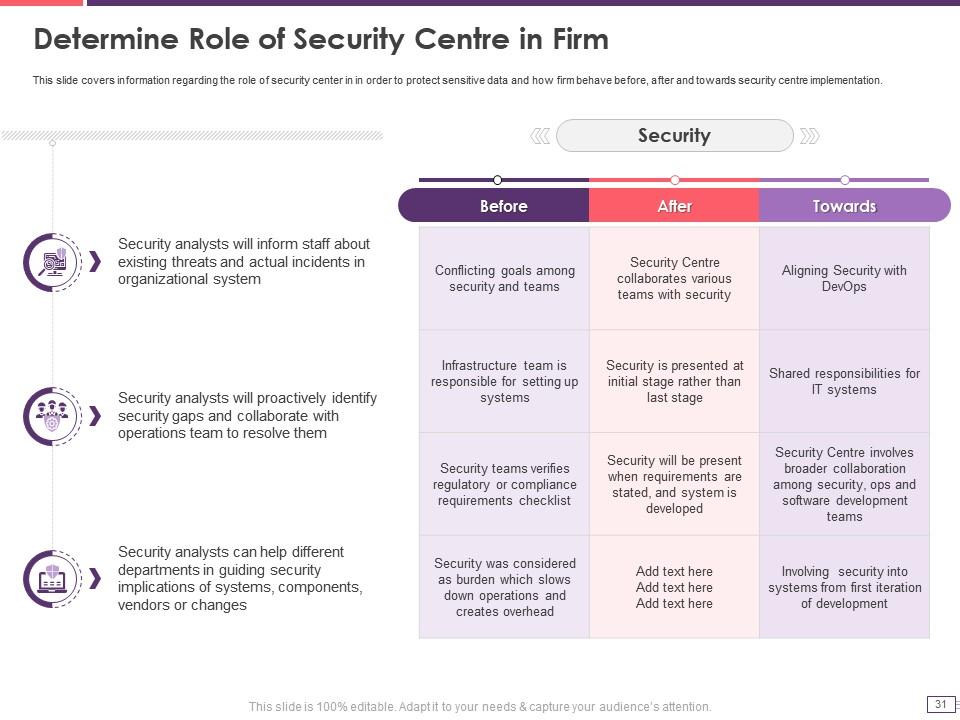
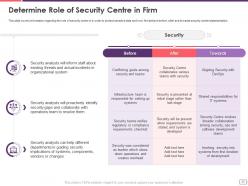
Slide 31: This slide covers information regarding the role of security center in order to protect sensitive data.
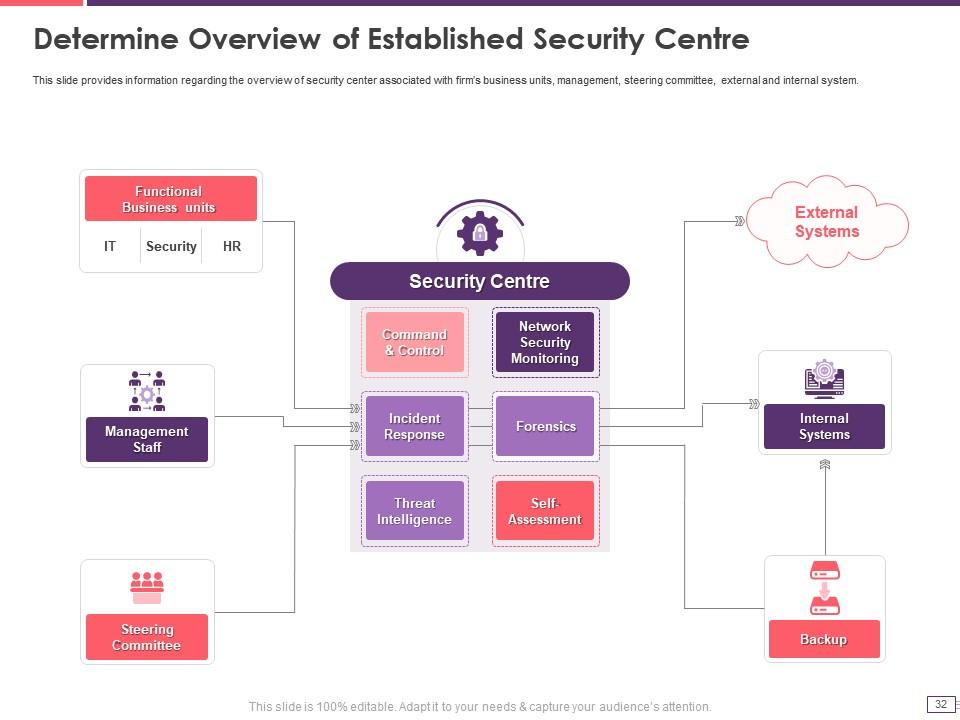
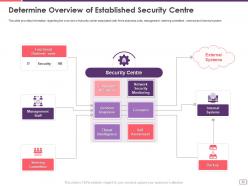
Slide 32: This slide explains the overview of security center associated with firm’s business units, management, steering committee, external and internal system.
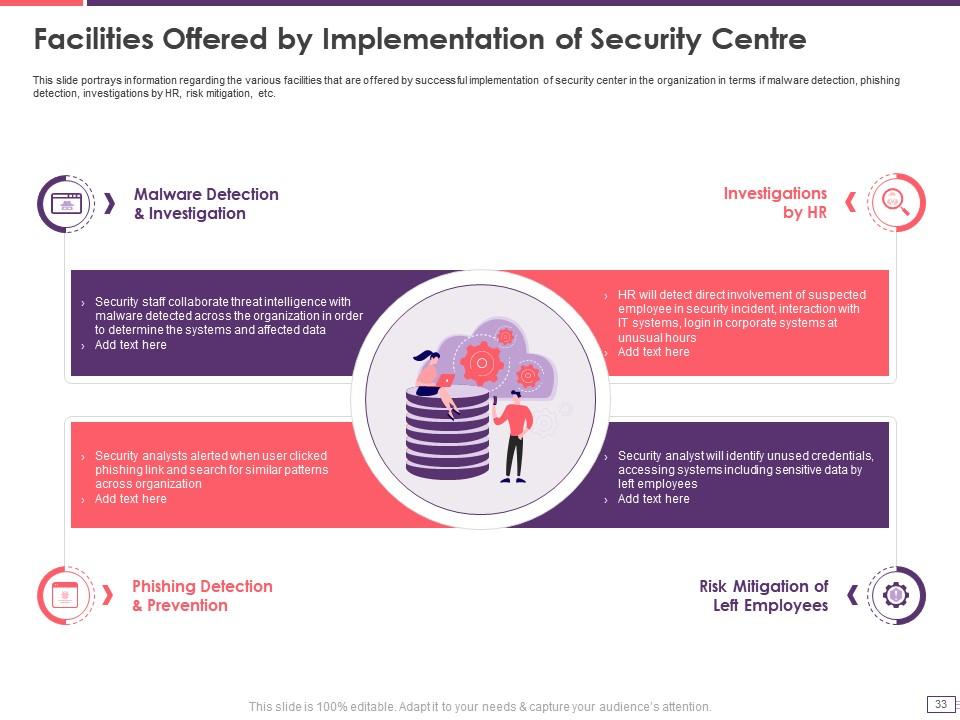
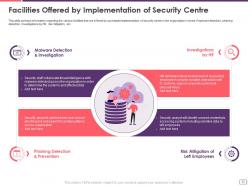
Slide 33: This slide portrays information regarding the various facilities that are offered by successful implementation of security center in the organization.
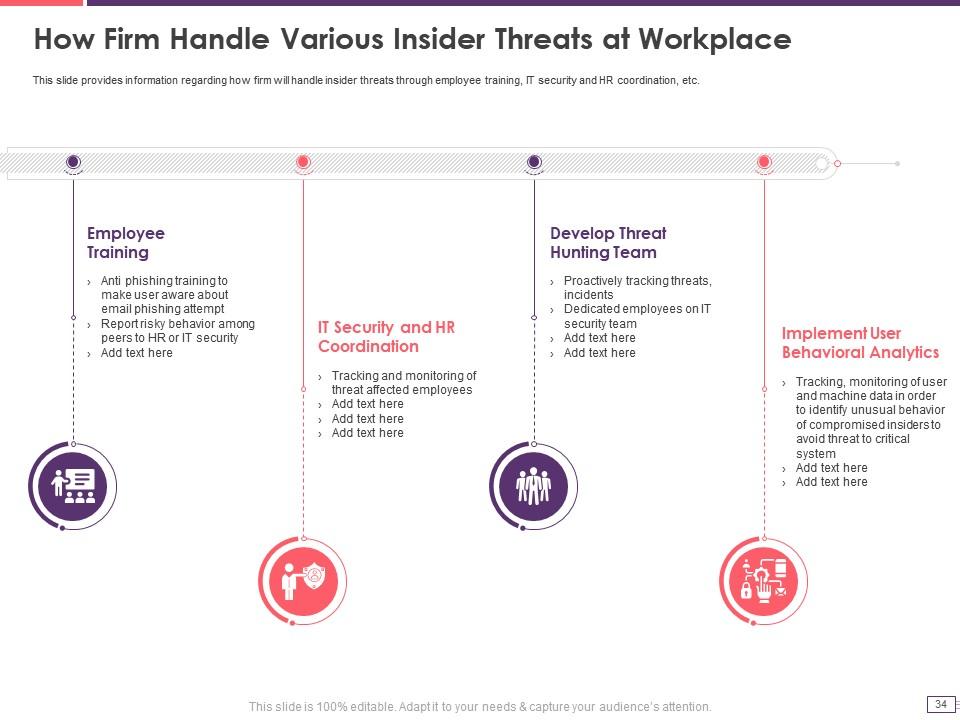
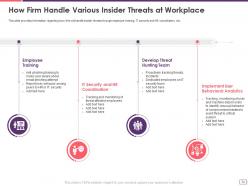
Slide 34: This slide provides information regarding how firm will handle insider threats through employee training, IT security and HR coordination, etc.
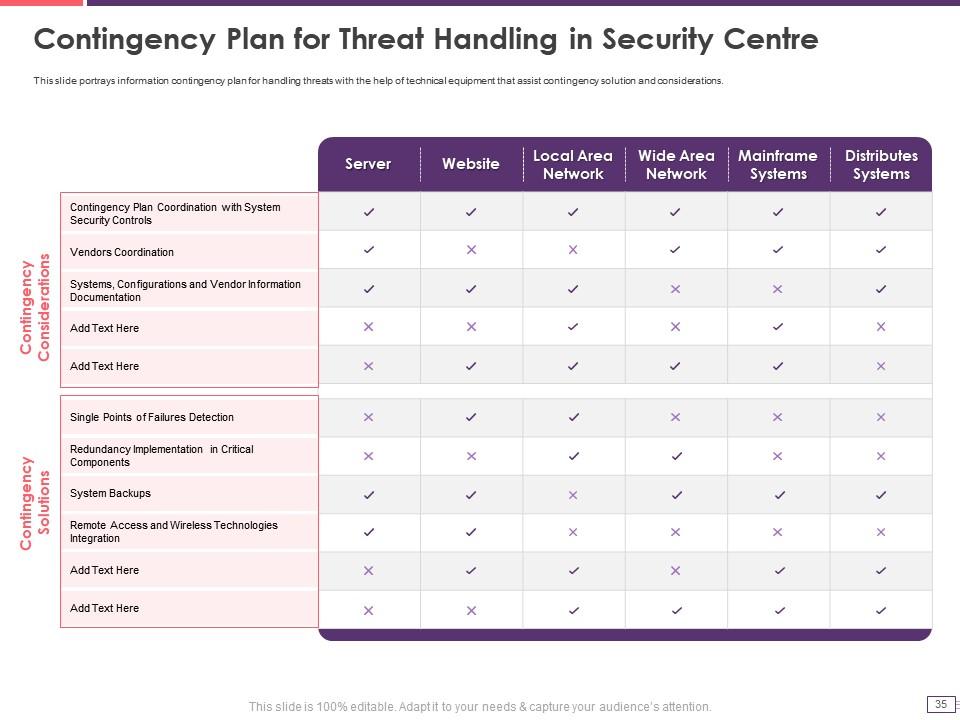
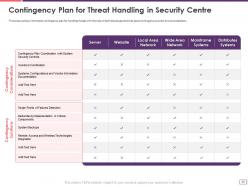
Slide 35: This slide portrays information contingency plan for handling threats with the help of technical equipment that assist contingency solution and considerations.
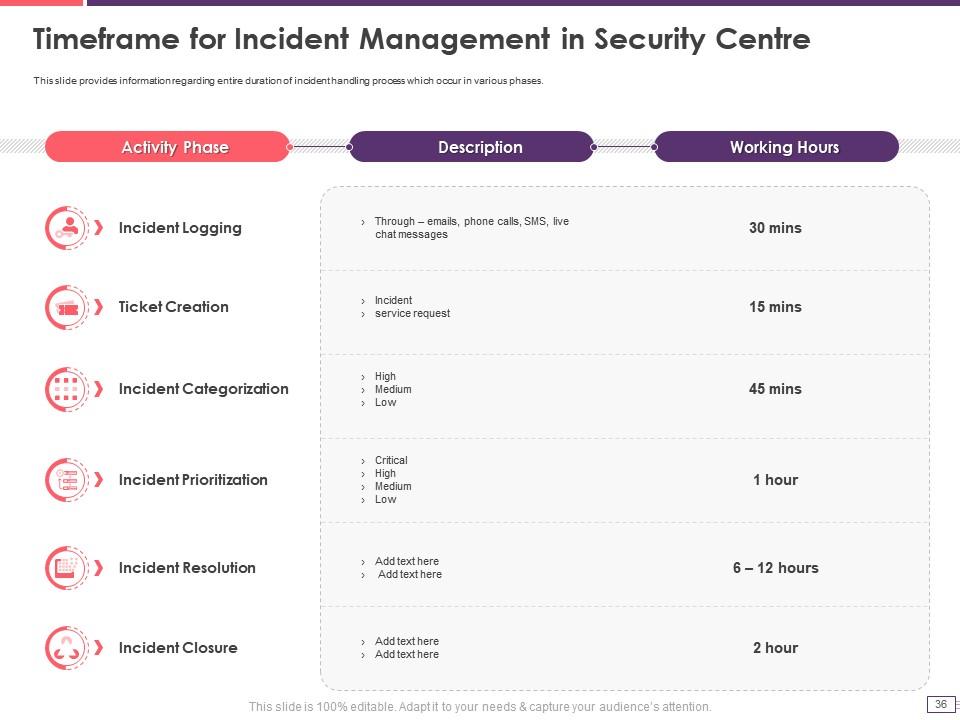
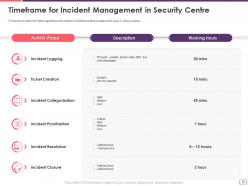
Slide 36: This slide provides information regarding entire duration of incident handling process which occur in various phases.
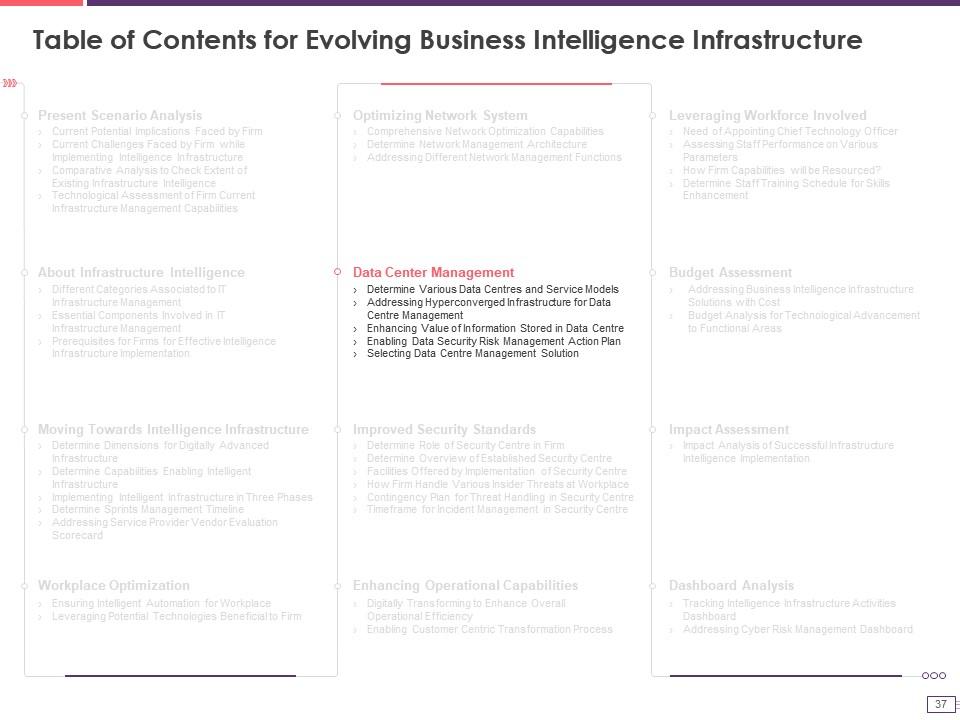
Slide 37: This slide presents the title for data center management.
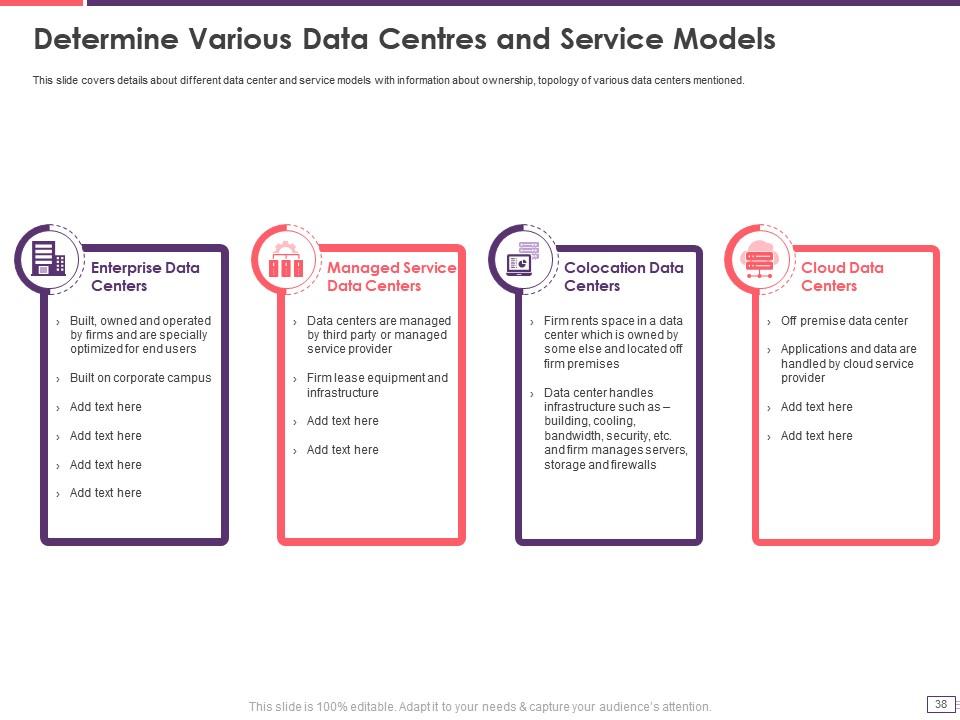
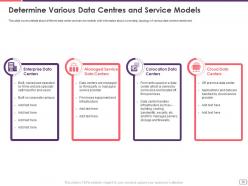
Slide 38: This slide covers details about different data center and service models with information about ownership, topology of various data centers mentioned.
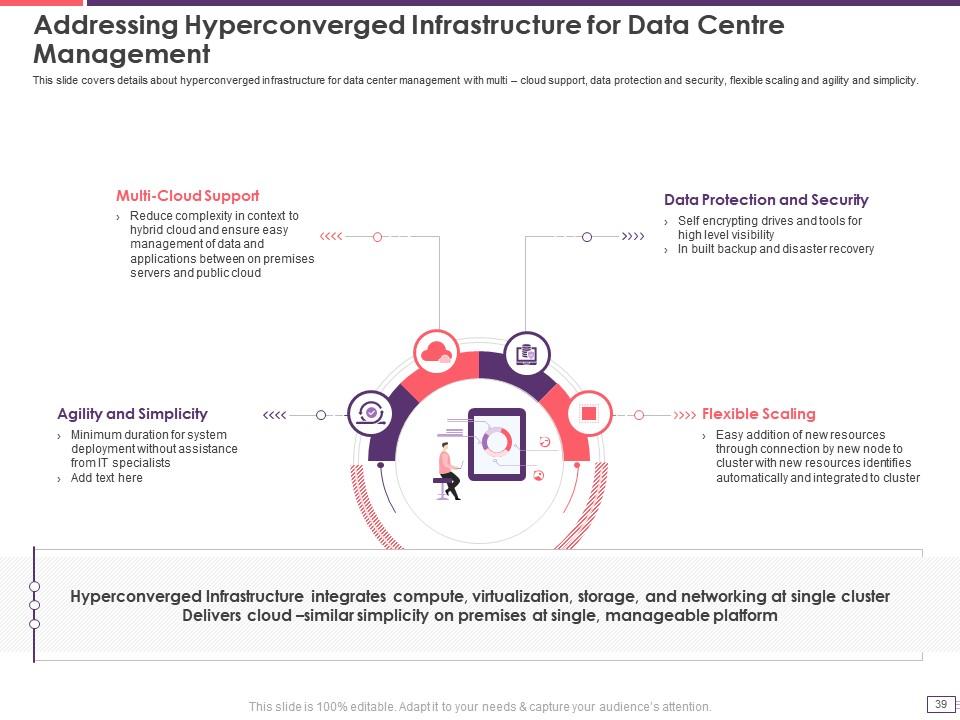
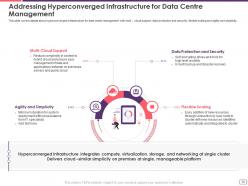
Slide 39: This slide demonstrates hyperconverged infrastructure for data center management with multi – cloud support, data protection and security, flexible scaling etc.
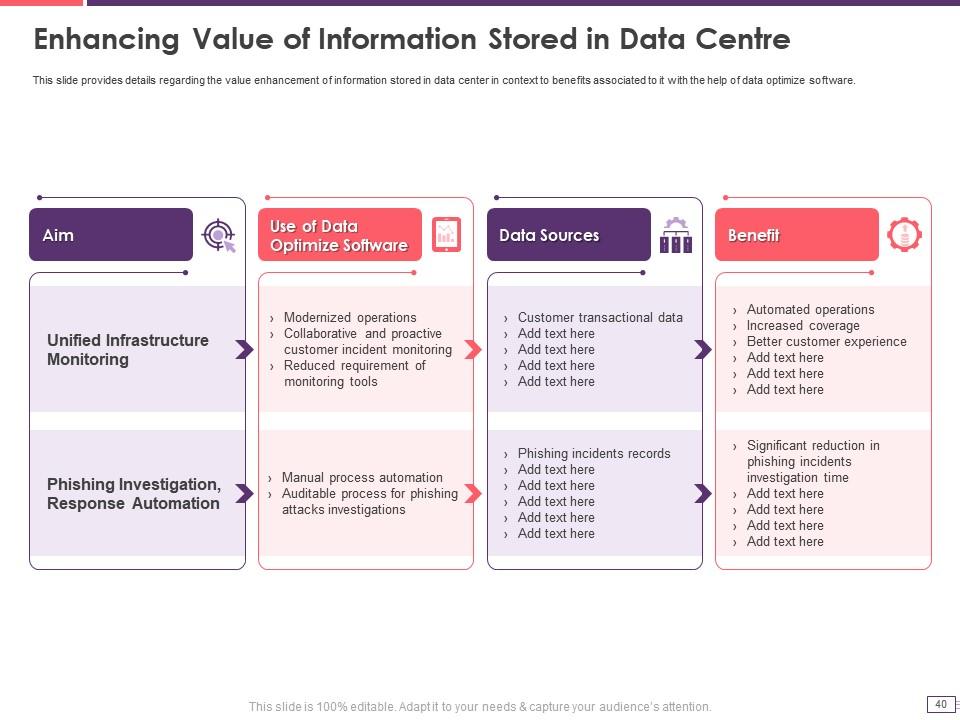
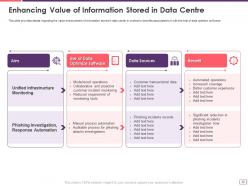
Slide 40: This slide presents the value enhancement of information stored in data center in context to benefits associated to it with the help of data optimize software.
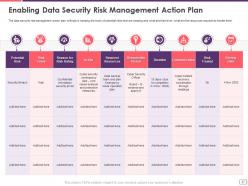
Slide 41: This slide exhibits the title for security risk management action plan.
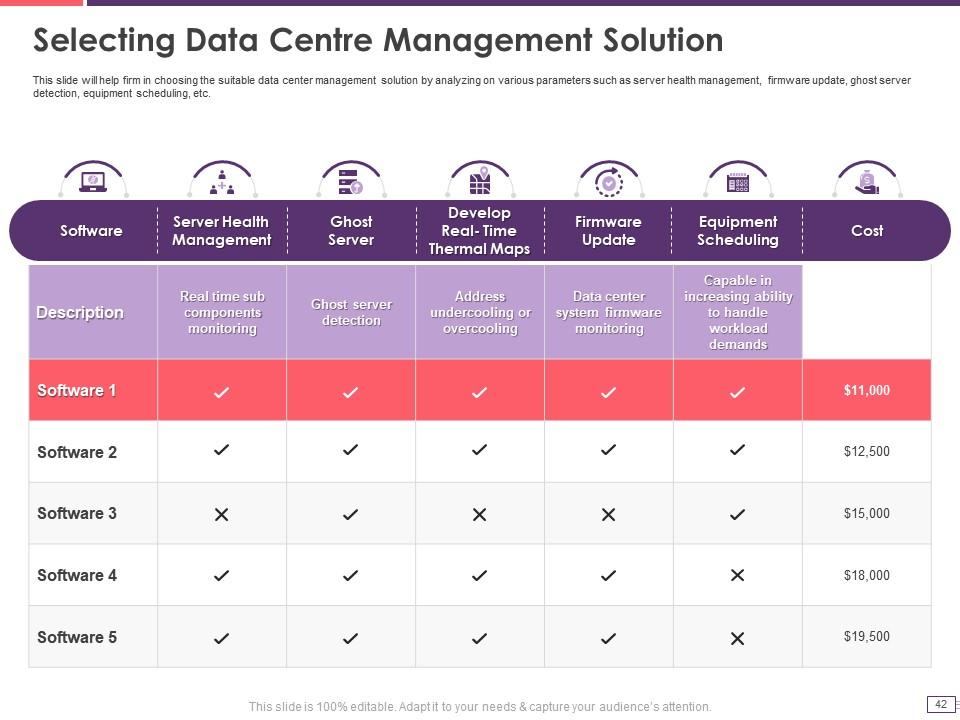
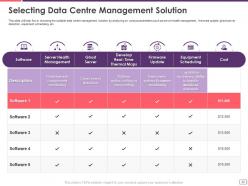
Slide 42: This slide will help firm in choosing the suitable data center management solution by analyzing on various parameters such as server health management, etc.
Slide 43: This slide exhibits the title for optimizing network system.
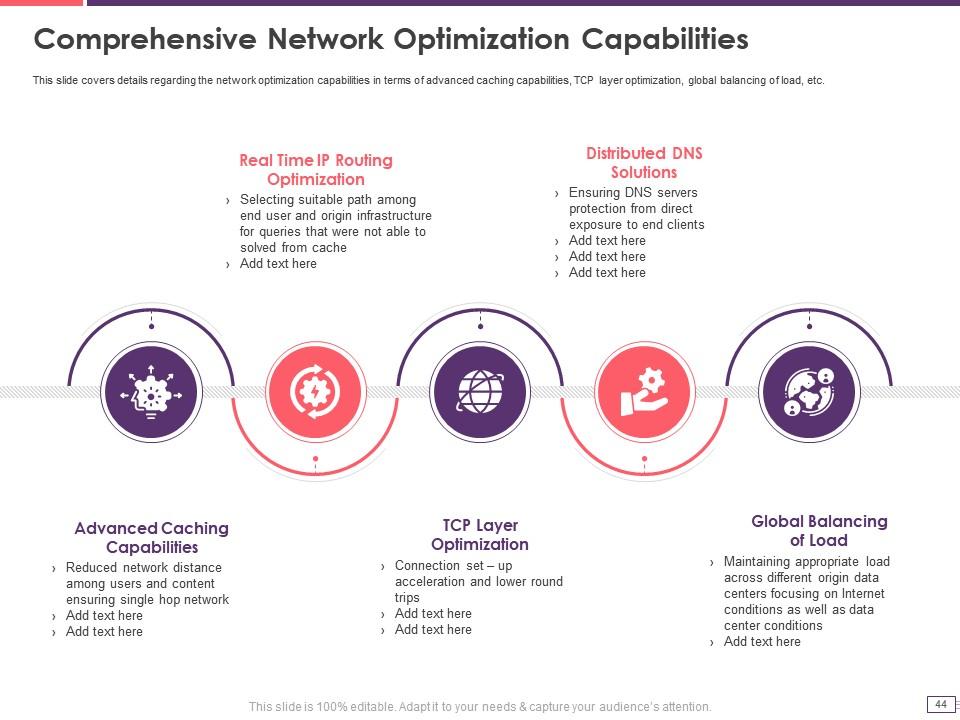
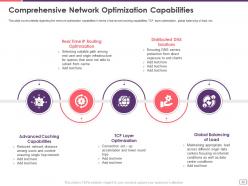
Slide 44: This slide explains the network optimization capabilities in terms of advanced caching capabilities, TCP layer optimization, global balancing of load, etc.
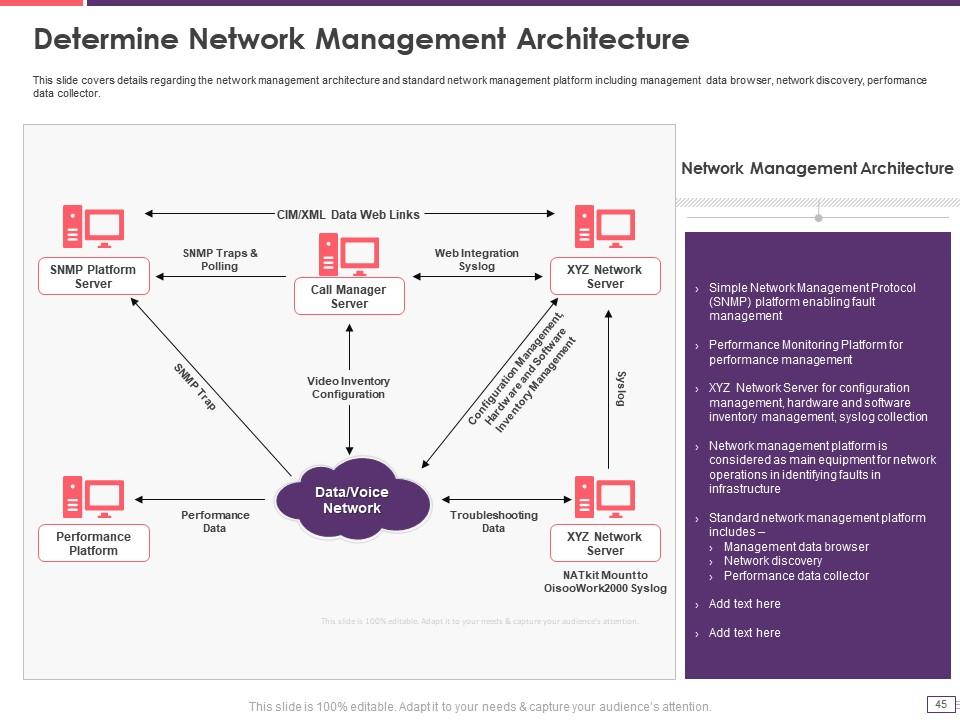
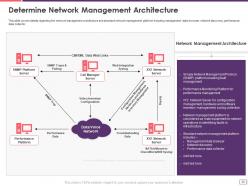
Slide 45: This slide displays the network management architecture and standard network management platform including management data browser, performance data collector, etc.
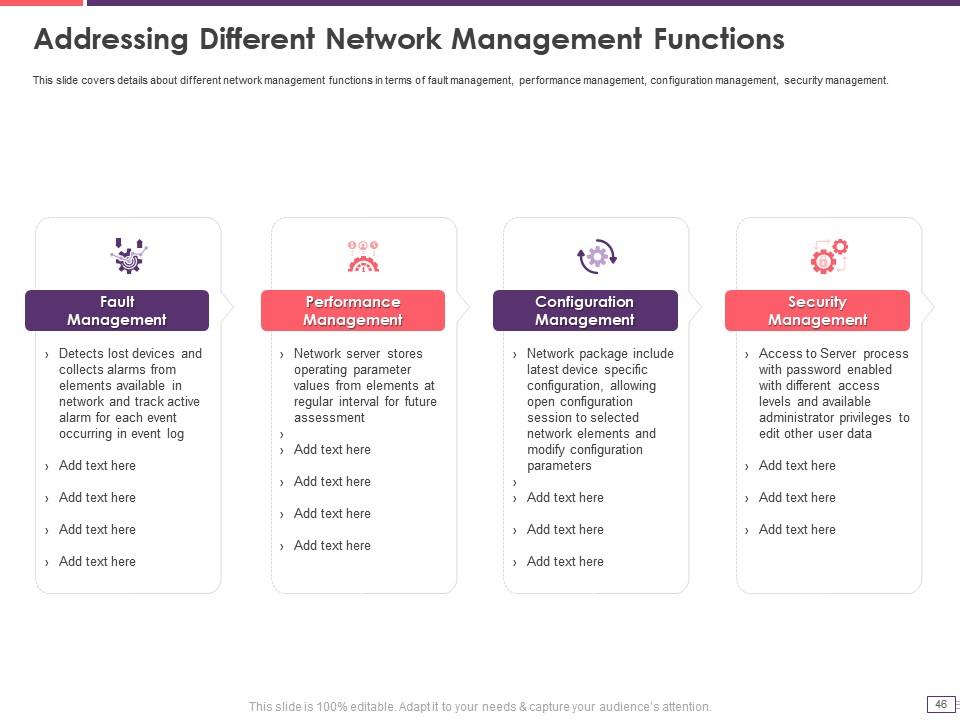
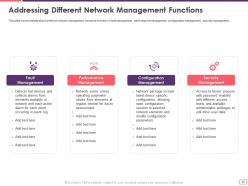
Slide 46: This slide explains different network management functions in terms of fault management, performance management, configuration management, security management.
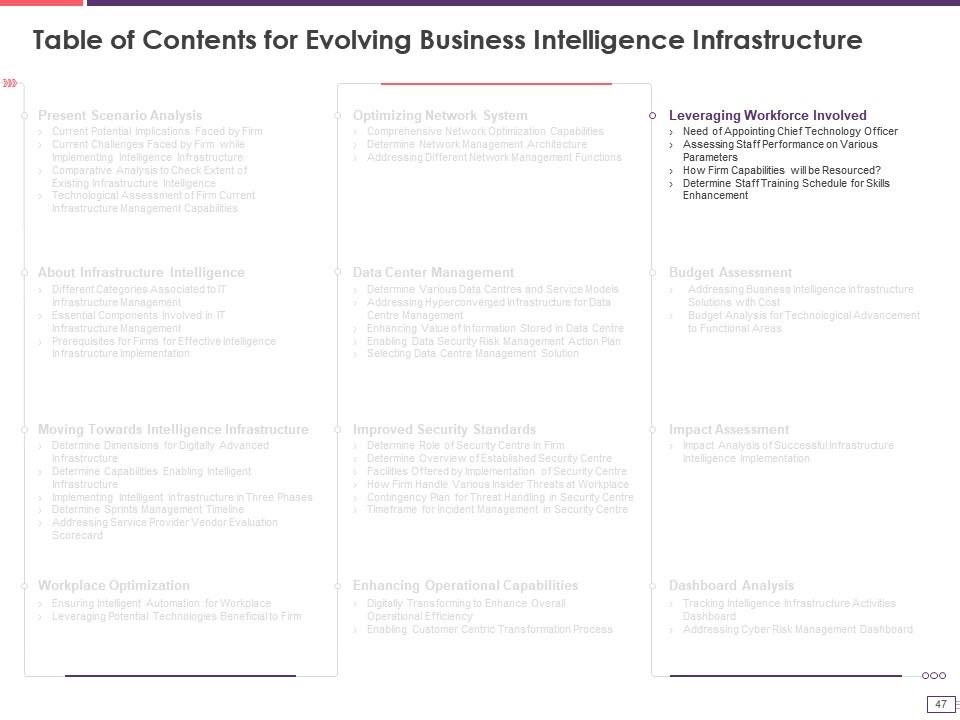
Slide 47: This slide displays the title for involvement of leverage workforce.
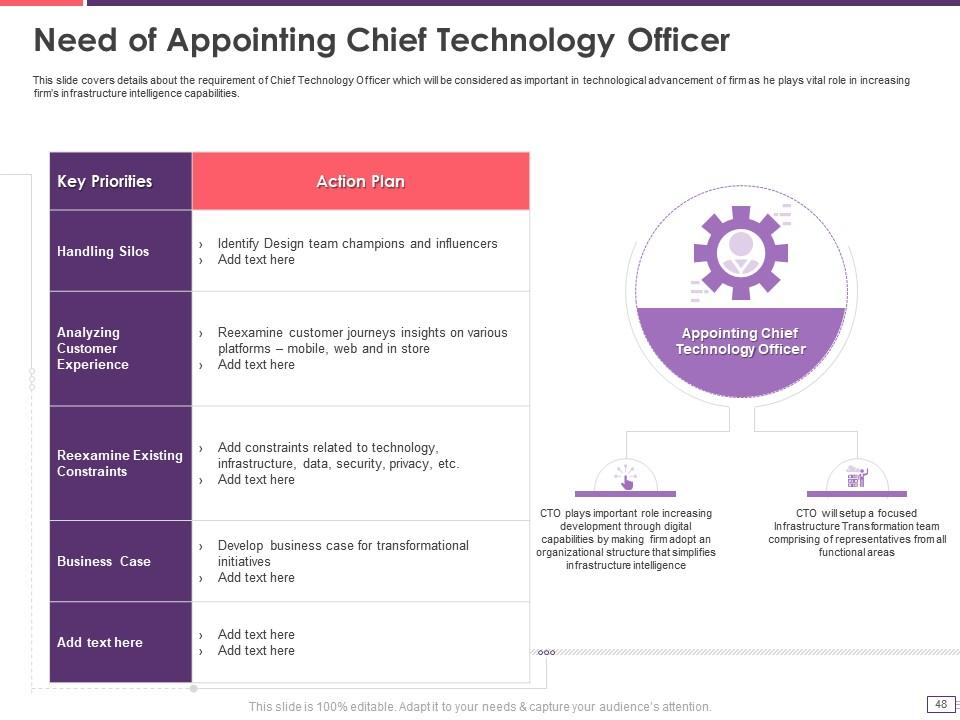
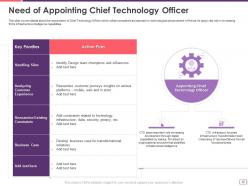
Slide 48: This slide explains the requirement of Chief Technology Officer which will be considered as important in technological advancement of firm.
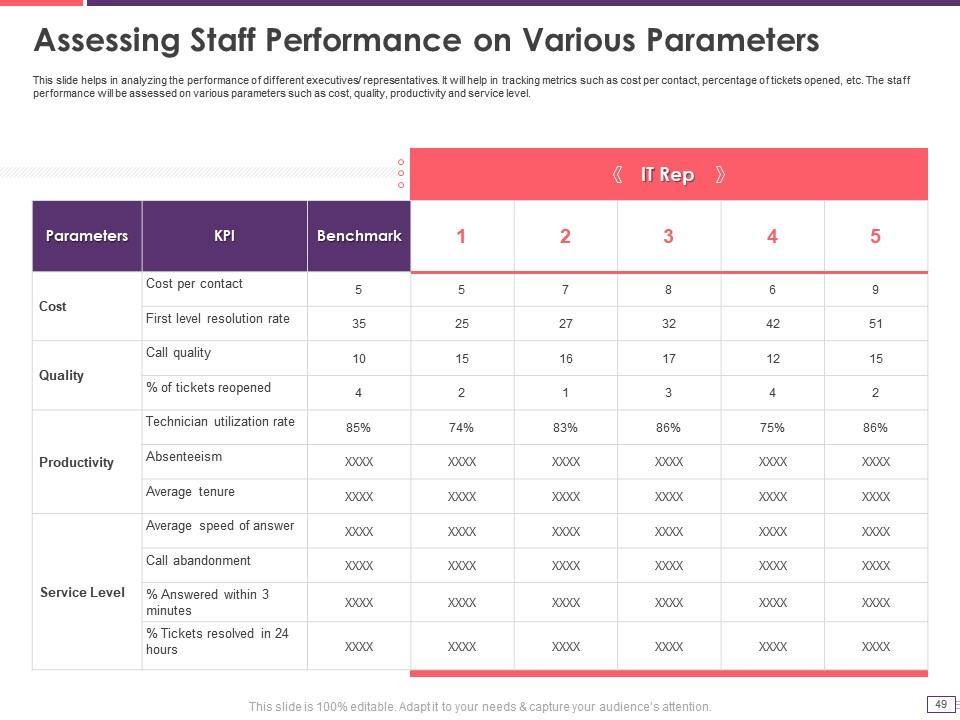
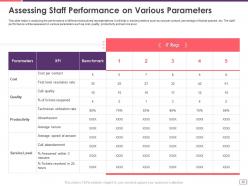
Slide 49: This slide helps in analyzing the performance of different executives/ representatives.
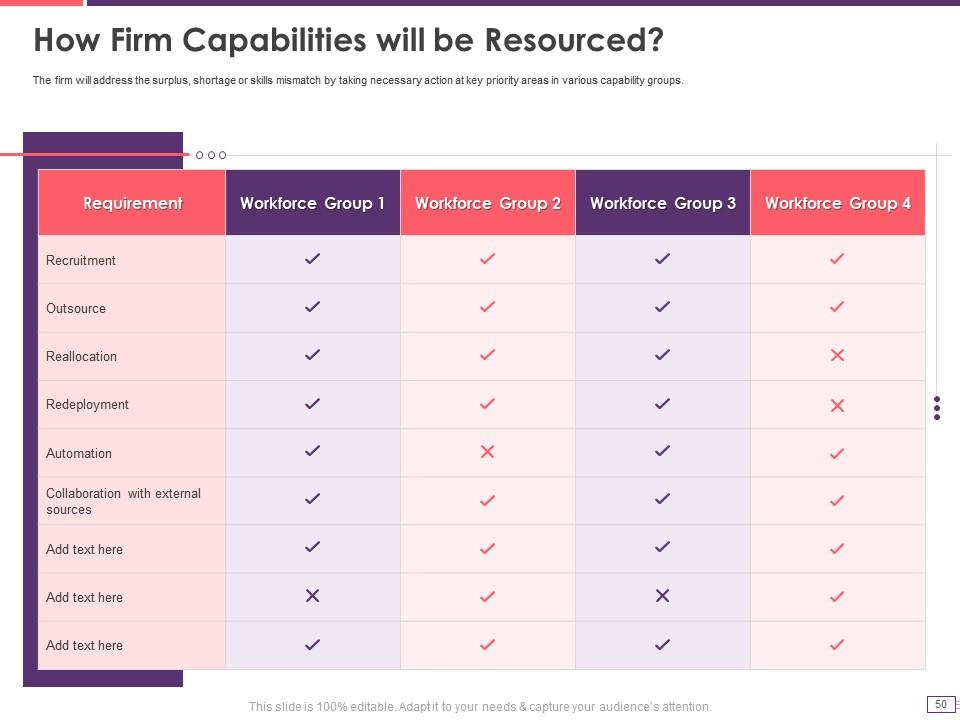
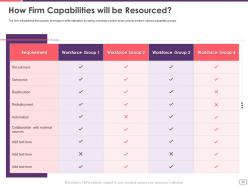
Slide 50: This slide presents the title for how firm capabilities will be resourced?
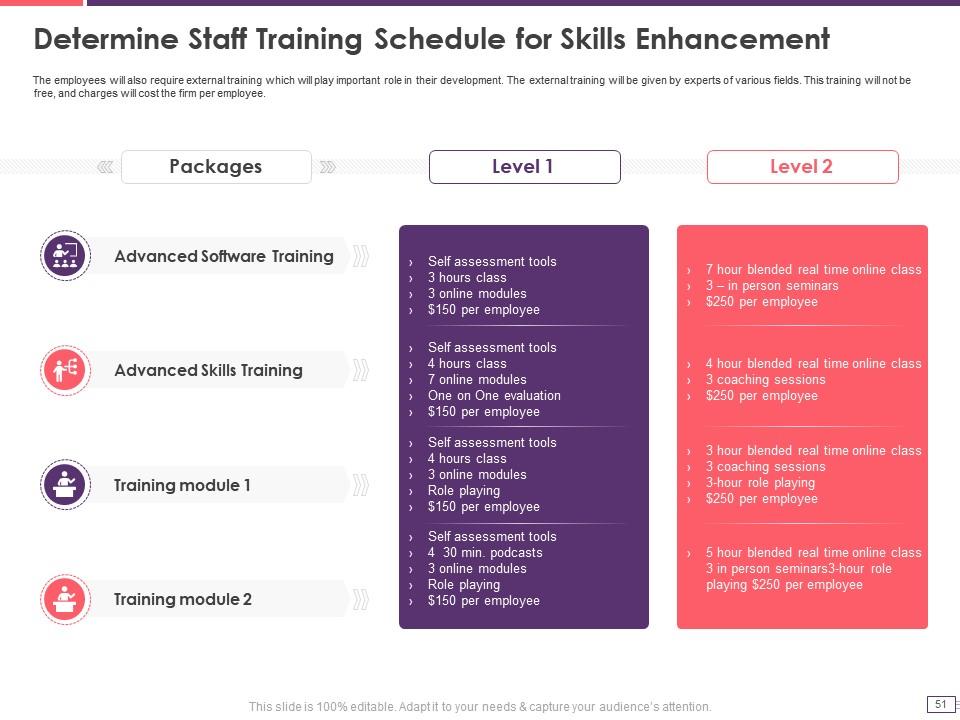
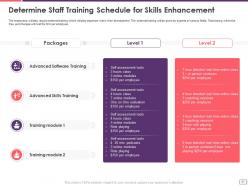
Slide 51: This slide exhibits the staff training schedule.
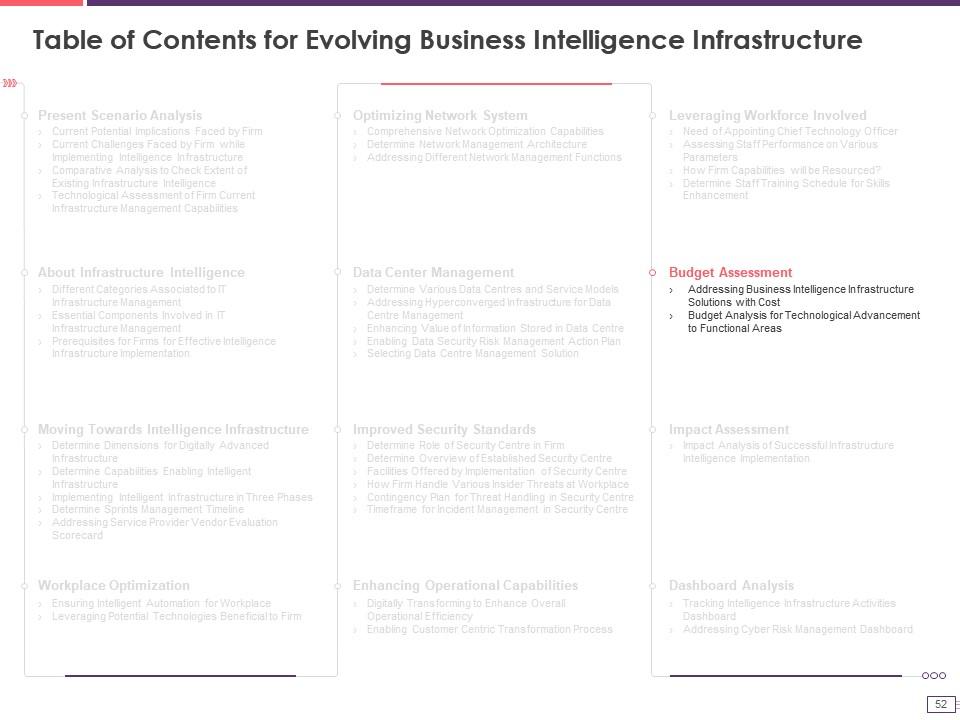
Slide 52: This slide demonstrates the title for budget assessment.
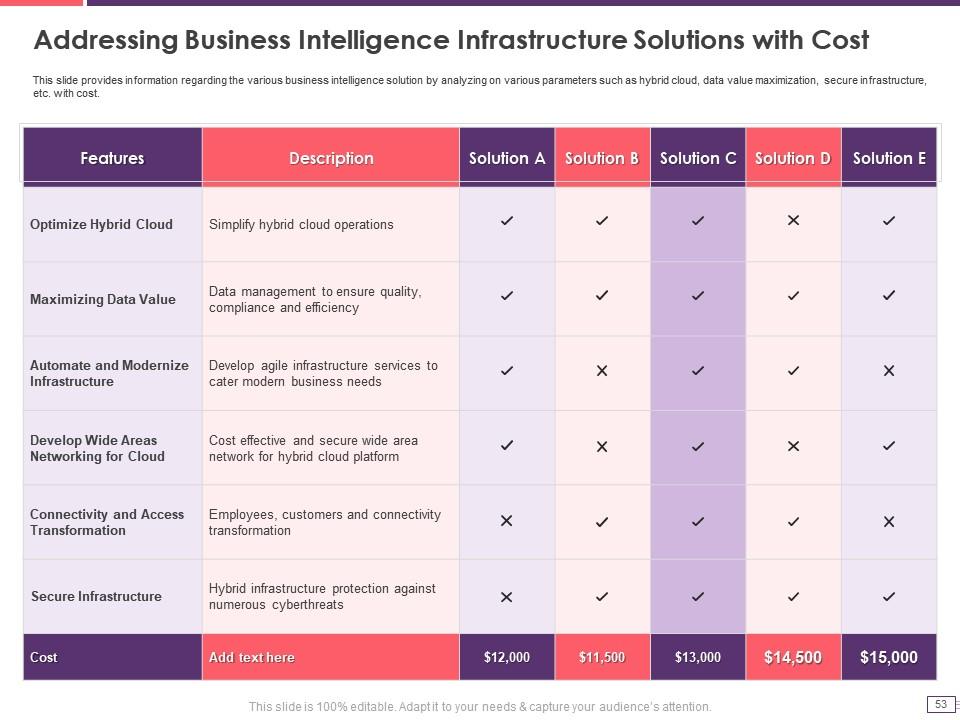
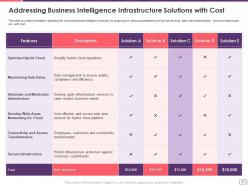
Slide 53: This slide explains the various business intelligence solution by analyzing on various parameters such as hybrid cloud, secure infrastructure, etc. with cost.
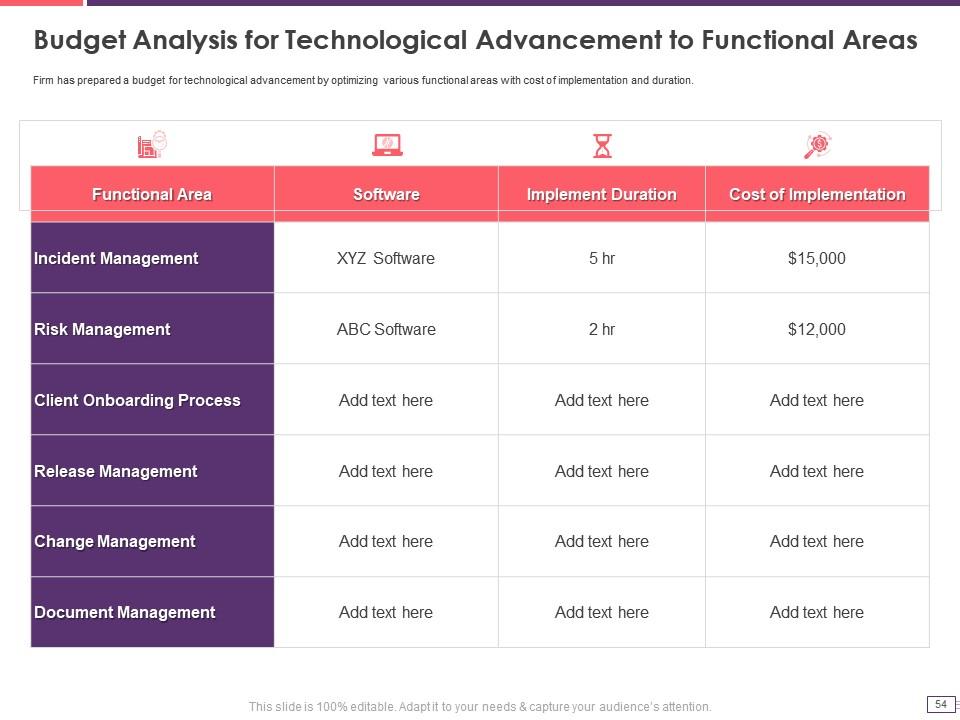
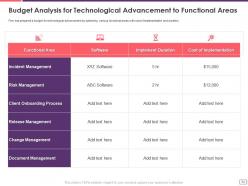
Slide 54: This slide explains the budget analysis for technological advancement.
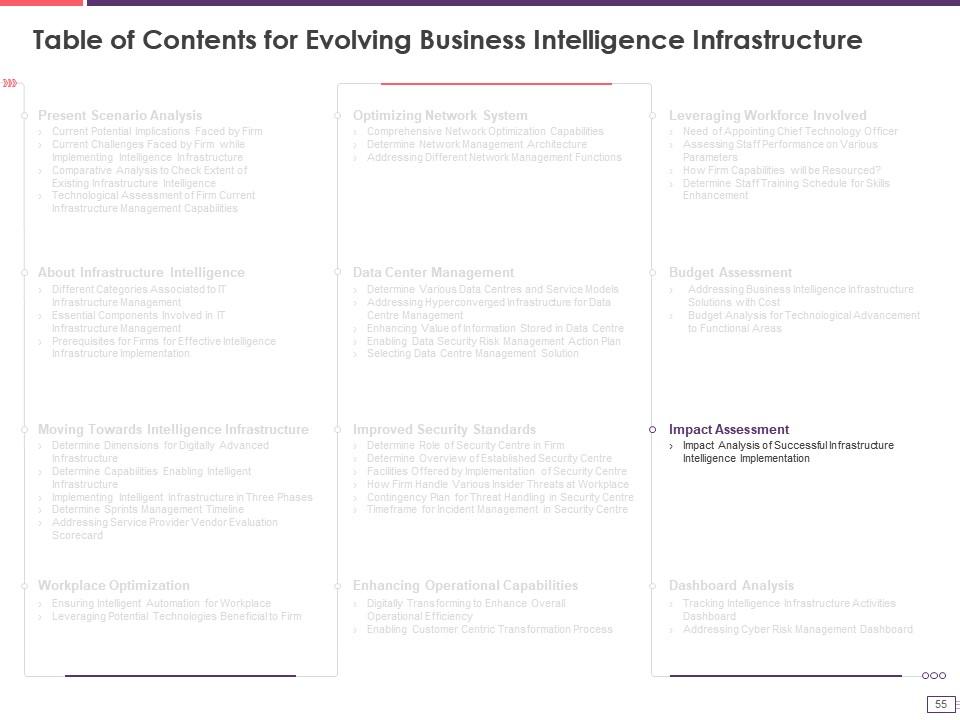
Slide 55: This slide displays the title for Impact assessment.
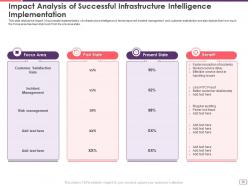
Slide 56: This slide depicts the impact of successful implementation of infrastructure intelligence in terms improved incident management and customer satisfaction.
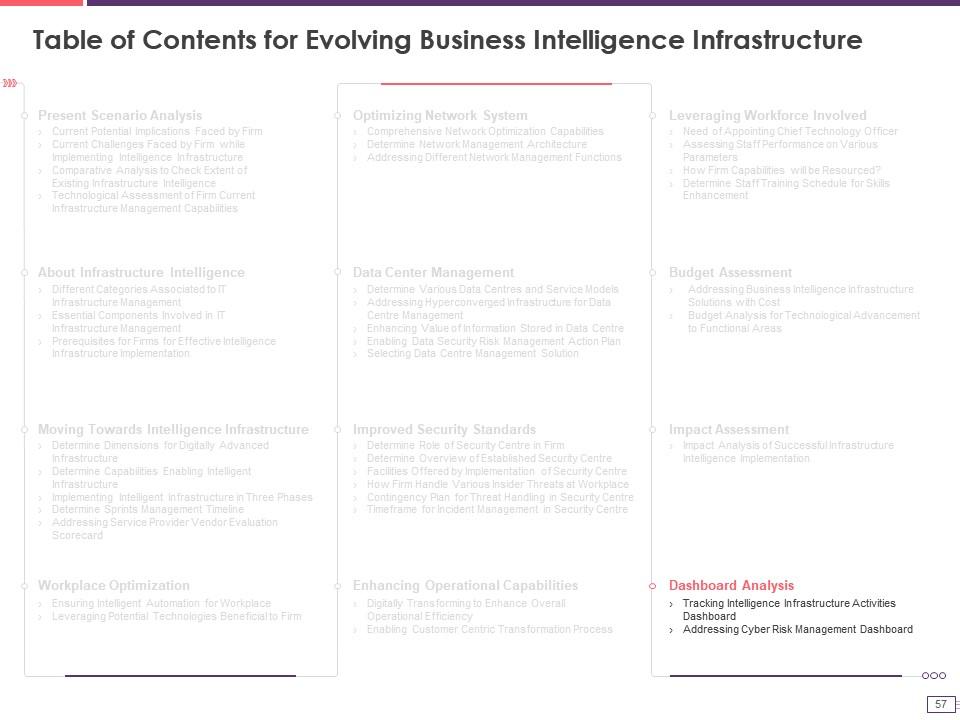
Slide 57: This slide presents the title for dashboard analysis.
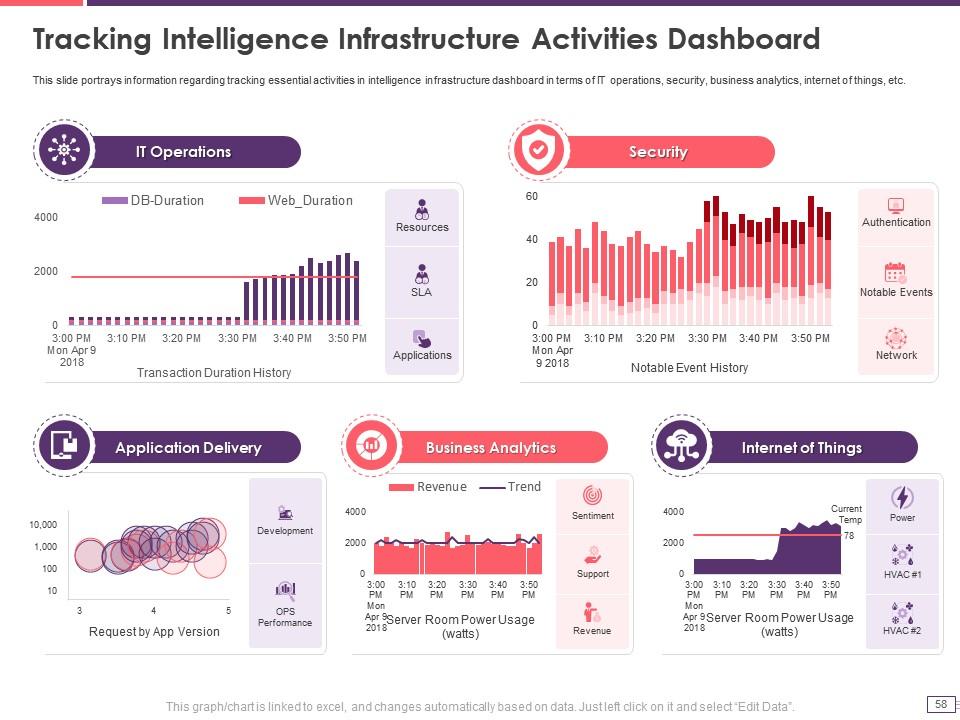
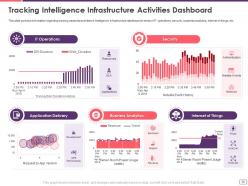
Slide 58: This slide portrays information regarding tracking essential activities in intelligence infrastructure dashboard in terms of IT operations, security, etc.
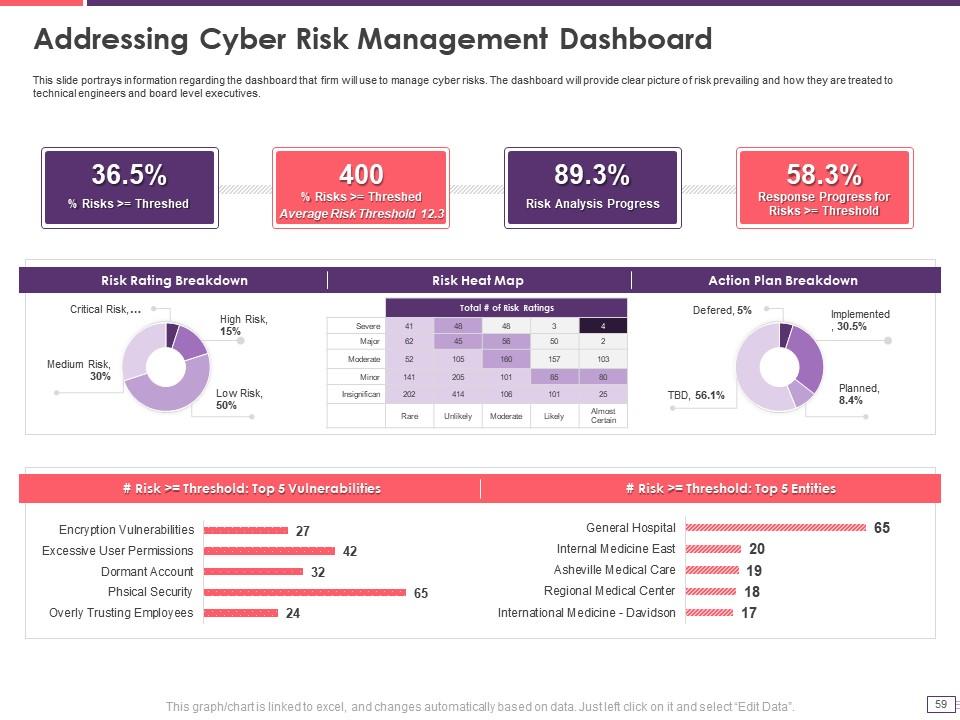
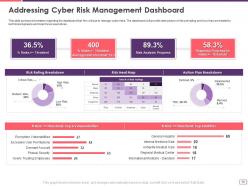
Slide 59: This slide portrays information regarding the dashboard that firm will use to manage cyber risks.
Slide 60: This is the icons slide for the project.
Slide 61: This slide displays the title for additional slides.
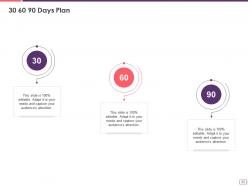
Slide 62: This slide displays the 30-60-90 days plan for your project.
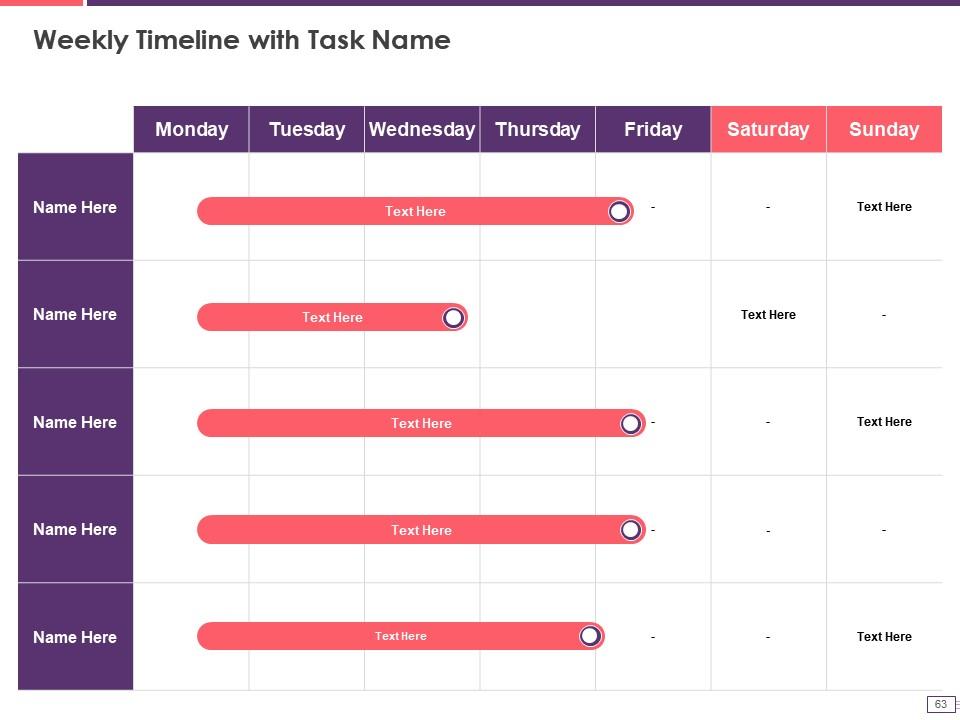
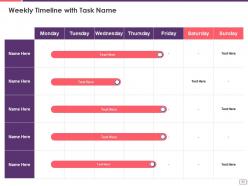
Slide 63: This slide exhibits the weekly timeline of the company.
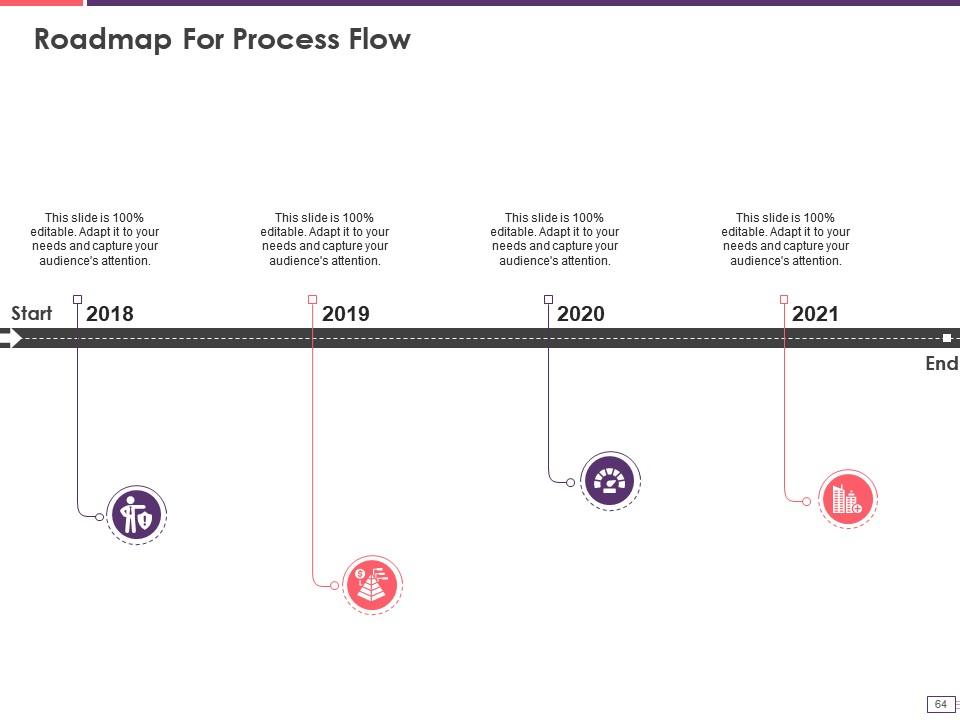
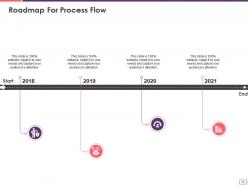
Slide 64: This slide exhibits the yearly roadmap of the company.
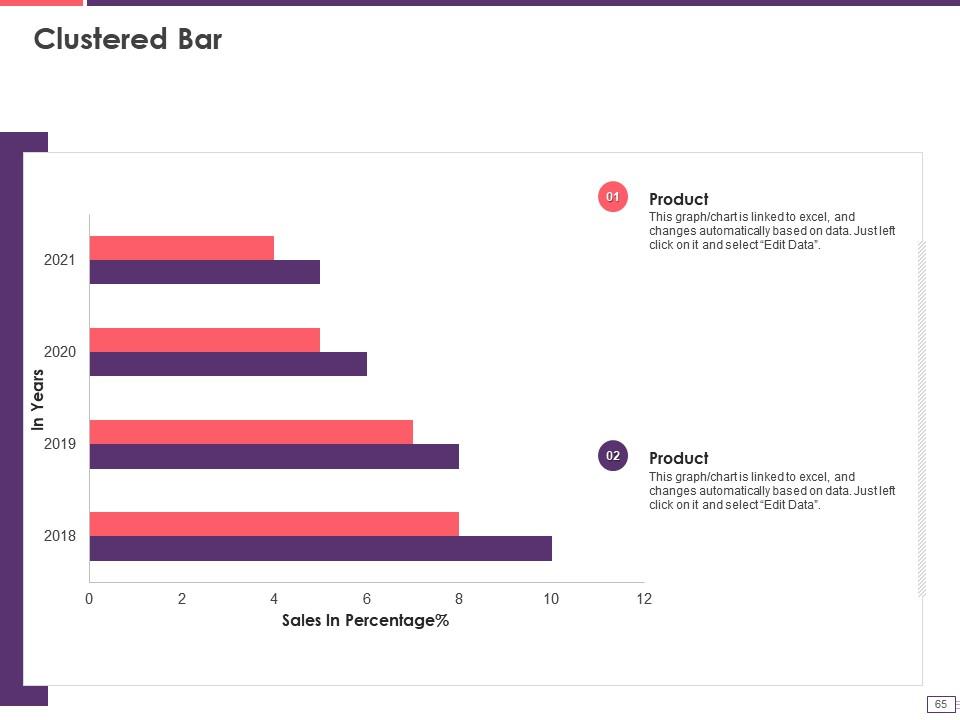
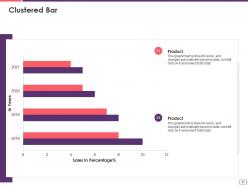
Slide 65: This slide presents the clustered bar graph related to products. The graphs are linked to Excel.
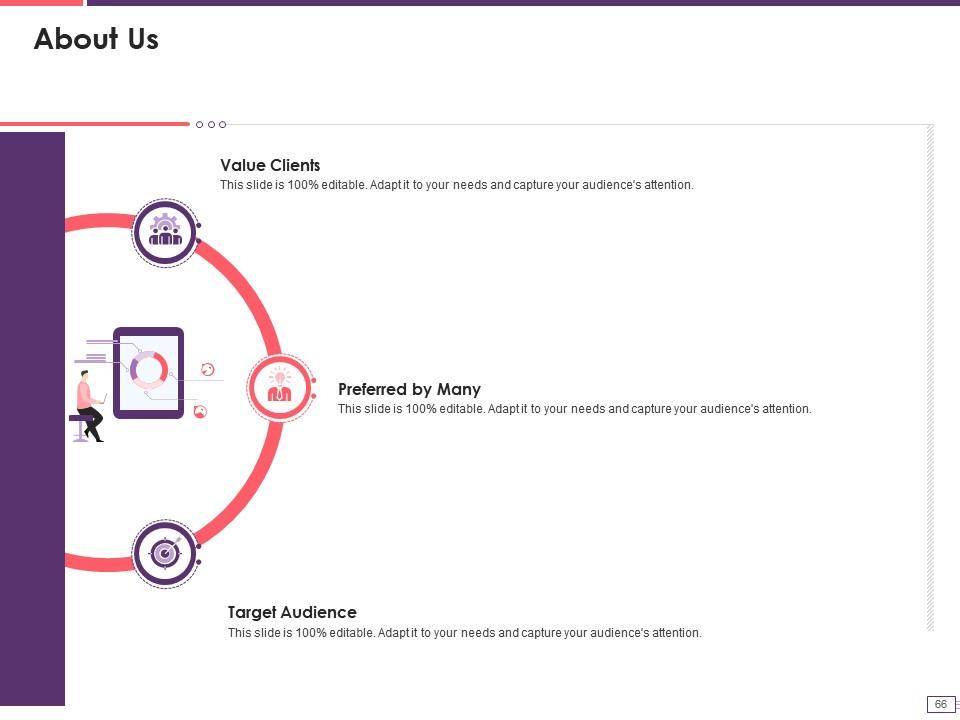
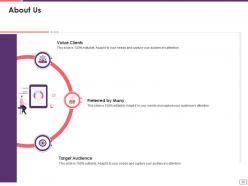
Slide 66: This slide showcases about the company, target audience and client's values.
Slide 67: This slide showcases the posts related to past experiences of clients.
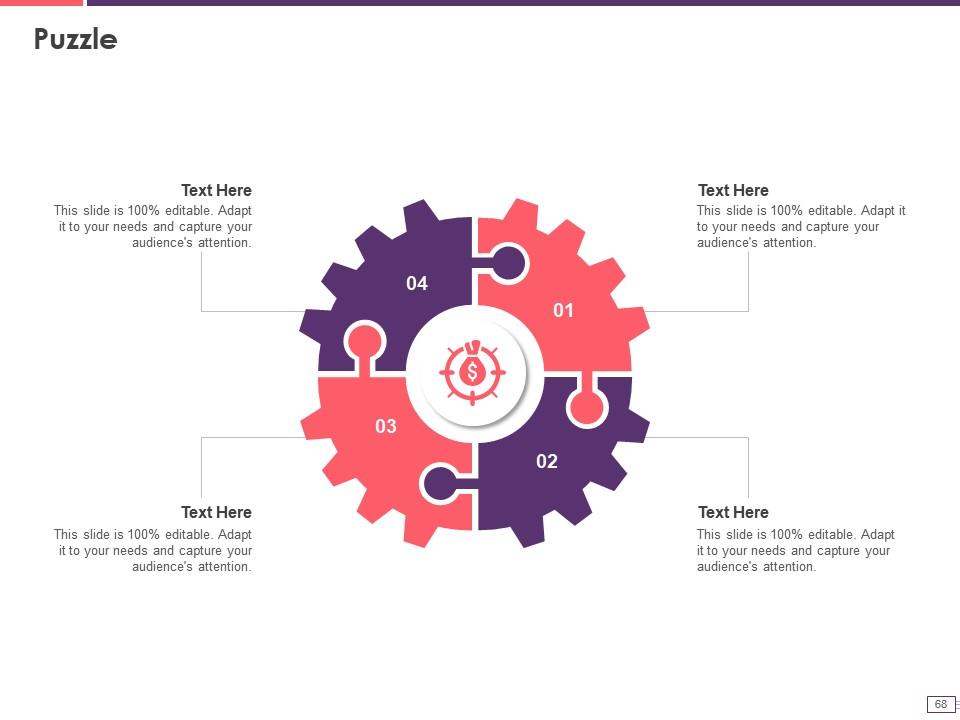
Slide 68: This slide explains the puzzle for your company.
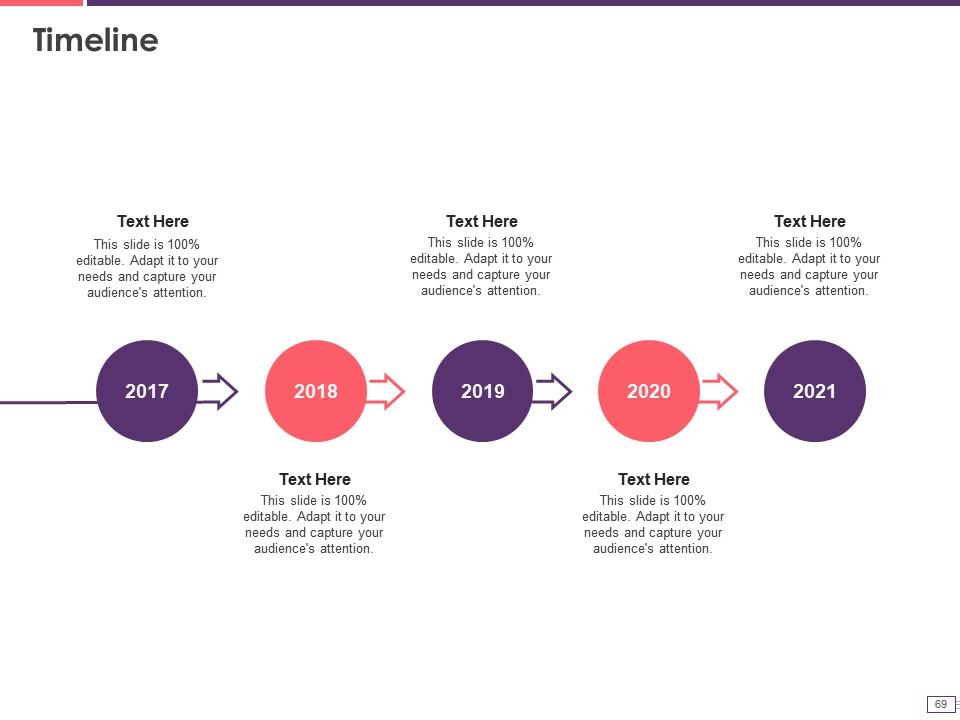
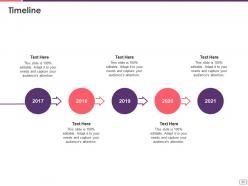
Slide 69: This slide exhibits the yearly timeline of the company.
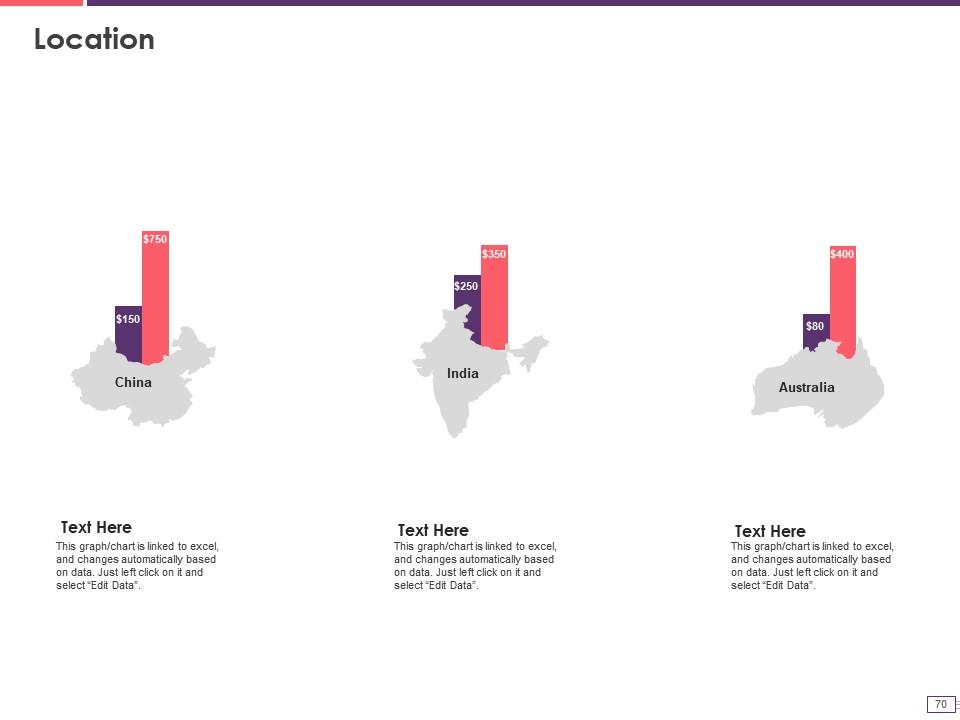
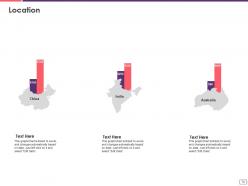
Slide 70: This slide exhibits the location of your company.
Slide 71: This is the thank you slide and displays the contact details of the company i.e. office address, contact number, etc.
Evolving business intelligence infrastructure powerpoint presentation slides with all 71 slides:
Use our Evolving Business Intelligence Infrastructure Powerpoint Presentation Slides to effectively help you save your valuable time. They are readymade to fit into any presentation structure.
-
Out of the box and creative design.
-
Great product with effective design. Helped a lot in our corporate presentations. Easy to edit and stunning visuals.
-
Visually stunning presentation, love the content.
-
Very unique, user-friendly presentation interface.
-
Understandable and informative presentation.
