

Executive summary ppt professional display






Try Before you Buy Download Free Sample Product
 Impress Your
Audience
 100%
Editable
 Save Hours
of Time


Clarify grey areas with our Executive Summary Ppt Professional Display. Fill in the gaps that crop up.
People who downloaded this PowerPoint presentation also viewed the following :
Content of this Powerpoint Presentation
Description:
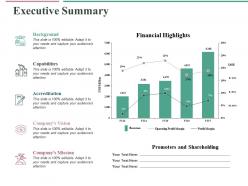
The image is a PowerPoint slide titled "Executive Summary," which is divided into two sections: qualitative information on the left and quantitative financial highlights on the right. It appears to be a part of a corporate presentation, likely used to summarize an organization's overview and financial performance.
On the left, the slide features several text placeholders for the following sections:
1. Background
2. Capabilities
3. Accreditation
4. Company’s Vision
5. Company’s Mission
On the right, there is a bar graph titled "Financial Highlights," displaying a company's Revenue (in USD millions), Operating Profit Margin, and Profit Margin over five fiscal years (FY13 to FY17). Key performance indicators such as Compound Annual Growth Rate (CAGR) and Net Income (NI) percentages are also depicted.
Use Cases:
This type of slide can be effectively used in a variety of industries for high-level corporate presentations:
1. Financial Services:
Use: Annual financial report presentations.
Presenter: CFO or Financial Analyst.
Audience: Investors, company board members.
2. Healthcare:
Use: Summarizing hospital or healthcare provider achievements and financial health.
Presenter: Healthcare Administrator.
Audience: Stakeholders, healthcare professionals.
3. Technology:
Use: Presenting a tech company's growth and innovation capabilities.
Presenter: CEO or CTO.
Audience: Shareholders, potential investors.
4. Manufacturing:
Use: Showcasing manufacturing capabilities and financial results.
Presenter: Operations Director.
Audience: Business partners, investors.
5. Education:
Use: Overview of an educational institution's background and financial stability.
Presenter: University President or Dean.
Audience: Board of trustees, donors.
6. Retail:
Use: Retail chain's performance summary and strategic direction.
Presenter: Retail Manager.
Audience: Shareholders, franchise owners.
7. Non-Profit Organizations:
Use: Demonstrating organizational impact and financial prudence.
Presenter: Executive Director.
Audience: Donors, grant organizations, volunteers.
Executive summary ppt professional display with all 5 slides:
Deliver amazing slideshows with our captivating Executive Summary Ppt Professional Display. You will definitely make an impact to thrill your colleagues.


FAQs for Executive summary
An executive summary presentation should include a compelling problem statement, clear solution overview, market opportunity analysis, competitive advantages, financial projections, and implementation timeline. These elements work together by establishing urgency, demonstrating value proposition, and providing actionable insights, with many executives finding that presentations combining strategic vision with concrete metrics ultimately deliver stronger stakeholder engagement and faster decision-making.
Visuals enhance complex data understanding by transforming abstract numbers into clear charts, graphs, infographics, and dashboards that executives can quickly interpret. These visual elements streamline decision-making by highlighting key trends, comparisons, and insights at a glance, with many organizations finding that well-designed visuals reduce presentation time while significantly improving stakeholder comprehension and engagement.
Common pitfalls include overwhelming executives with excessive detail, burying key insights in dense slides, failing to lead with clear recommendations, and neglecting to quantify business impact through concrete metrics. These presentation mistakes often result from misunderstanding executive priorities, with many organizations finding that streamlined, outcome-focused summaries deliver significantly better stakeholder engagement and faster decision-making processes.
Executive summary presentations should adopt a confident, strategic tone with clear, persuasive language focused on key decisions and outcomes, while detailed reports use analytical, comprehensive language with extensive supporting data. The presentation style emphasizes visual storytelling, compelling narratives, and executive-level insights that drive action, whereas reports prioritize thoroughness and documentation, with many organizations finding that this strategic differentiation enhances leadership engagement.
Tailoring executive summary presentations involves adjusting content focus, communication style, technical depth, and outcome emphasis based on stakeholder priorities and expertise levels. For investors, emphasize financial projections and ROI, while technical teams require implementation details, and C-suite executives need strategic implications, with many organizations finding that stakeholder-specific customization significantly enhances engagement and decision-making outcomes.
Executive summaries condense information by prioritizing key findings, strategic recommendations, financial implications, and actionable next steps while eliminating supporting details. This approach enables executives to quickly grasp essential insights, make informed decisions faster, and allocate resources strategically, with many organizations finding that well-structured summaries accelerate approval processes and enhance stakeholder alignment.
Storytelling transforms executive summary presentations by creating emotional connections, making complex data memorable, and guiding audiences through a logical narrative arc from challenge to solution. Through compelling narratives, executives can illustrate market opportunities, demonstrate competitive advantages, and showcase strategic outcomes more persuasively, with many organizations finding that story-driven presentations significantly enhance stakeholder engagement and decision-making speed.
Incorporating infographics enhances executive summary presentations by transforming complex data into digestible visual narratives, simplifying key metrics, and highlighting critical trends that might be overlooked in text-heavy slides. These visual elements enable executives to grasp strategic insights quickly, streamline decision-making processes, and facilitate more engaging stakeholder discussions, ultimately delivering clearer communication and faster consensus-building.
Maintaining audience engagement requires strategic storytelling through compelling visuals, clear data narratives, and interactive elements like polls or Q&A segments. These approaches streamline complex information delivery while encouraging participation, with many executives finding that incorporating real-world case studies, maintaining consistent eye contact, and using strategic pauses ultimately delivers more impactful presentations and stronger stakeholder buy-in.
Effectiveness can be evaluated through stakeholder feedback surveys, follow-up meeting requests, decision timeline acceleration, and resource allocation outcomes. Organizations increasingly track metrics like proposal acceptance rates, investor engagement levels, and implementation approval speed, with many executives finding that compelling summaries generate immediate next-step commitments and strategic discussions within 48 hours.
**INPUT**: What tools or software are recommended for creating professional executive summary presentations? **OUTPUT**: Recommended tools include PowerPoint, Keynote, Google Slides, Prezi, and Canva, each offering distinct advantages for executive-level presentations. These platforms enhance professional delivery by providing sophisticated templates, data visualization capabilities, and seamless collaboration features, with many organizations finding that strategic tool selection significantly streamlines presentation development while delivering polished, impactful executive communications. [Word count: 54 words]
Feedback from past executive summary presentations reveals patterns in audience engagement, clarity gaps, and persuasiveness effectiveness, enabling strategic refinements in content structure, visual design, and delivery approach. Organizations analyzing presentation outcomes can streamline messaging, enhance data visualization, and optimize timing, with many executives finding that systematic feedback integration ultimately delivers more compelling narratives and improved stakeholder buy-in.
Key metrics include audience engagement levels, decision-making speed, follow-up meeting requests, stakeholder buy-in rates, and action item completion percentages. These indicators help executives assess presentation effectiveness by tracking participant attention, faster strategic decisions, and increased collaboration requests, with many organizations finding that successful executive summaries ultimately accelerate project approvals and enhance resource allocation efficiency.
Cultural differences significantly impact executive summary presentations through varying communication styles, hierarchy expectations, decision-making processes, and data presentation preferences across international contexts. While Western cultures often favor direct, concise summaries with immediate recommendations, Asian markets typically require detailed context and consensus-building elements, with many multinational organizations finding that adapting presentation structures to local cultural norms enhances stakeholder engagement and accelerates decision-making processes.
Best practices for rehearsing and delivering executive summary presentations include thorough preparation, timing practice, stakeholder alignment, clear messaging, and confident delivery techniques. Through structured rehearsals, executives can streamline their key points, anticipate questions, and enhance their storytelling, while many organizations find that mock presentations with cross-functional teams ultimately deliver more compelling stakeholder engagement and strategic buy-in.
-
Visually stunning presentation, love the content.
-
Informative design.