

Exhaustive digital transformation deck digital finance dashboard





Try Before you Buy Download Free Sample Product
 Impress Your
Audience
 100%
Editable
 Save Hours
of Time


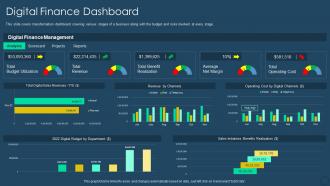
This slide covers transformation dashboard covering various stages of a business along with the budget and risks involved at every stage.
People who downloaded this PowerPoint presentation also viewed the following :
Exhaustive digital transformation deck digital finance dashboard with all 7 slides:
Use our Exhaustive Digital Transformation Deck Digital Finance Dashboard to effectively help you save your valuable time. They are readymade to fit into any presentation structure.






FAQs for Exhaustive digital transformation deck
Effective digital finance dashboards should include cash flow metrics, revenue and expense tracking, budget variance analysis, key performance indicators, and real-time profitability measures. These comprehensive metrics enable organizations to streamline financial decision-making, enhance operational visibility, and accelerate strategic planning, with many financial teams finding that integrated dashboards ultimately deliver faster reporting cycles and improved competitive advantage.
Data visualization techniques enhance financial data understanding by transforming complex numbers into intuitive charts, graphs, heat maps, and trend lines that reveal patterns instantly. Through interactive dashboards, financial teams can quickly identify spending anomalies, track budget performance, and monitor cash flow trends, while stakeholders gain immediate insights into profitability and risk metrics, ultimately enabling faster decision-making and strategic financial planning.
**INPUT**: What tools and software are best suited for creating a digital finance dashboard? **OUTPUT**: Leading digital finance dashboard tools include Tableau, Power BI, Qlik Sense, Looker, and specialized platforms like Adaptive Insights and Anaplan. These solutions streamline financial reporting by automating data integration, enabling real-time visualization, and delivering customizable analytics, with many financial institutions finding that cloud-based platforms ultimately enhance operational efficiency and strategic decision-making capabilities. **Word count: 56 words**
A digital finance dashboard supports real-time decision-making by providing instant access to key financial metrics, automated alerts for anomalies, and integrated data visualization across multiple revenue streams. Through real-time analytics, organizations streamline budget adjustments, accelerate investment decisions, and enhance cash flow management, with many financial institutions finding that immediate data visibility delivers significant competitive advantages.
Common challenges include data integration complexity, user adoption resistance, system compatibility issues, security concerns, and cost management. While these obstacles can initially slow implementation, organizations across sectors like banking and manufacturing find that strategic planning, comprehensive training, and phased rollouts ultimately deliver enhanced financial visibility and operational efficiency.
A digital finance dashboard integrates with existing financial systems through APIs, data connectors, and cloud-based synchronization protocols that enable real-time data flow from ERP systems, accounting software, and banking platforms. These integrations streamline financial reporting by automatically consolidating data from multiple sources, eliminating manual entry processes, and delivering enhanced visibility across departments, ultimately enabling faster decision-making and improved operational efficiency.
User experience plays a critical role in digital finance dashboard design by ensuring intuitive navigation, clear data visualization, and seamless accessibility across devices. Effective UX design streamlines complex financial information through organized layouts, responsive interfaces, and personalized features, ultimately enabling faster decision-making, reducing user errors, and enhancing overall financial management efficiency for individuals and organizations.
Organizations ensure data accuracy and integrity through automated data validation rules, real-time synchronization with source systems, regular audit trails, and standardized data governance protocols. Financial institutions and retail companies implement multi-layered verification processes, automated reconciliation checks, and role-based access controls, ultimately delivering reliable reporting and enhanced decision-making confidence across departments.
Industry-specific indicators include regulatory compliance metrics, loan-to-deposit ratios, customer acquisition costs, transaction volumes, and risk assessment scores for financial services. These dashboards enable banks, credit unions, and fintech companies to streamline operations, enhance regulatory reporting, and deliver faster customer services, while ultimately providing competitive advantage through real-time financial insights and improved decision-making capabilities.
A digital finance dashboard facilitates better budgeting and forecasting by providing real-time data visualization, automated reporting capabilities, and predictive analytics tools that streamline financial planning processes. These platforms enable organizations to track spending patterns, identify budget variances, and generate accurate forecasts, with many financial institutions finding that integrated dashboards ultimately deliver enhanced decision-making speed and improved resource allocation efficiency.
Artificial intelligence and machine learning enhance finance dashboards through predictive analytics, automated anomaly detection, intelligent data categorization, real-time fraud identification, and personalized financial insights. These technologies streamline financial operations by delivering proactive risk assessments, automated expense tracking, and customized reporting, with many financial institutions finding that AI-powered dashboards significantly reduce manual processing while enhancing decision-making accuracy.
Determining the right audience for a digital finance dashboard involves analyzing user roles, data requirements, decision-making responsibilities, and technical proficiency levels across your organization. Through stakeholder mapping and user interviews, companies identify whether executives need high-level KPIs, managers require operational metrics, or analysts need granular data access, ultimately delivering targeted insights that enhance financial decision-making and strategic planning.
Customization options should include role-based access controls, personalized KPI displays, adjustable reporting frequencies, configurable alert thresholds, and flexible visualization formats. These features enable different stakeholders, from CFOs requiring strategic overviews to analysts needing detailed metrics, to access relevant financial insights efficiently, ultimately enhancing decision-making speed and organizational transparency.
Storytelling through data in digital finance dashboards involves creating narrative flows through progressive disclosure, comparative visualizations, trend analysis, and contextual annotations that guide users through financial insights. Interactive elements like drill-down capabilities, time-series progressions, and scenario modeling enable finance teams to uncover patterns, communicate performance drivers, and present compelling business cases that transform raw financial data into strategic narratives.
Best practices include establishing automated data integration, conducting regular performance reviews, implementing user feedback mechanisms, maintaining data accuracy protocols, and scheduling periodic design updates. These approaches streamline dashboard management by ensuring real-time information flow, responsive user experiences, and evolving analytical capabilities, with many financial institutions finding that consistent maintenance cycles ultimately deliver enhanced decision-making accuracy and operational efficiency.
-
Designs have enough space to add content.
-
Excellent Designs.