


Financial chart with checklist and icons powerpoint slides





Try Before you Buy Download Free Sample Product
 Impress Your
Audience
 100%
Editable
 Save Hours
of Time


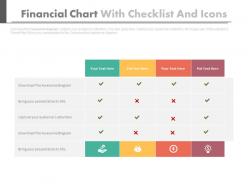
Checklist charts are used worldwide for conducting different studies. Ours is a subject specific chart under the head financial chart with checklist and icons PowerPoint slides. The provided checklist chart PPT PowerPoint presentation model is applicable for making marketing and business presentations. Managers and entrepreneurs, who are well organized for their work structure, often make use of the provided checklist PPT example. Our experts have designed the checklist chart in a manner that it has a section of particulars with respective space for marking ticks below the parameters or sub heads mentioned at top. Glam to glory is the use of PPT icons in the bottom most section. PowerPoint infographic always increase the visual significance of the monotonous financial presentations. Maintenance of checklist PowerPoint slide design background depicts your personal level of sincerity and professionalism attached towards the execution of the task. Make use of colorful marks of ticks and cross to further glorify the predesigned and well crafted financial checklist PPT presentation template. Entice your audience with our Financial Chart With Checklist And Icons Powerpoint Slides. They will soon be eating out of your hands.
People who downloaded this PowerPoint presentation also viewed the following :
Financial chart with checklist and icons powerpoint slides with all 4 slides:
People will surely forget what you said but you can be sure they won't forget how you made them feel. Add emotions during presentations with great Financial Chart With Checklist And Icons Powerpoint Slides.


FAQs for Financial chart with checklist and
Financial presentation slides should include executive summary highlights, revenue and profit trends, key performance indicators, cash flow analysis, and comparative benchmarks against industry standards. These elements work together by providing stakeholders with comprehensive insights, enabling faster decision-making and strategic planning, with many organizations finding that clear financial storytelling ultimately drives investor confidence and operational alignment.
Visuals like graphs, charts, and infographics transform complex financial data into digestible insights by highlighting trends, comparing performance metrics, and simplifying numerical relationships that would otherwise overwhelm audiences. Through strategic visual design, financial institutions, investment firms, and corporate teams can accelerate decision-making processes, enhance stakeholder comprehension, and ultimately deliver more compelling presentations that drive actionable outcomes.
Common pitfalls include overcrowding slides with excessive data, using inconsistent formatting across charts, neglecting to highlight key insights, and failing to provide clear context for financial metrics. These mistakes can confuse stakeholders and undermine credibility, with many finance teams finding that streamlined visuals, consistent design standards, and strategic data storytelling ultimately deliver more persuasive presentations and better decision-making outcomes.
Tailoring financial presentation slides involves adjusting data complexity, focus areas, and narrative emphasis based on audience needs and interests. For investors, emphasize growth metrics, market opportunities, and ROI projections, while internal stakeholders require operational details, departmental performance, and resource allocation insights, with many organizations finding that audience-specific customization significantly enhances engagement and decision-making outcomes.
Storytelling transforms financial presentations by creating narrative flow that connects data points, establishes context for numbers, and guides audiences through logical progressions from problems to solutions. Through compelling narratives, financial professionals can frame quarterly results, budget proposals, and investment opportunities as coherent stories, helping stakeholders understand implications while making complex financial data more memorable and persuasive.
Financial data can be simplified through strategic visualization techniques, progressive disclosure methods, clear hierarchical structuring, and focused storytelling that highlights key insights while maintaining comprehensive supporting details. By using intuitive charts, layered information architecture, and contextual annotations, financial presentations enable audiences to grasp complex concepts quickly while preserving analytical rigor, ultimately delivering enhanced comprehension and more effective decision-making processes.
Financial presentation color best practices include using neutral palettes with strategic accent colors, maintaining consistent branding, ensuring high contrast for readability, and limiting colors to 3-4 maximum per slide. Professional designs emphasize clean layouts, consistent fonts, and strategic use of white space, with many financial institutions finding that blues and grays convey trust while selective color highlights enhance data comprehension and audience engagement.
Financial presentation slides should be updated monthly for routine metrics, quarterly for comprehensive reviews, and immediately when significant changes occur like mergers, regulatory updates, or market shifts. Many organizations find that establishing automated data feeds for real-time metrics, combined with scheduled template refreshes, ensures accuracy while minimizing manual effort, ultimately delivering more credible presentations and faster decision-making.
Tools for creating high-quality financial presentation slides include PowerPoint, Google Slides, Prezi, Canva, and specialized platforms like SlideTeam. These solutions streamline design processes by offering pre-built templates, automated chart generation, and professional formatting options, with many financial institutions finding that dedicated presentation platforms significantly reduce preparation time while enhancing visual impact and stakeholder engagement.
Case studies enhance financial slides by providing concrete context, demonstrating practical applications, and making abstract data more accessible to diverse audiences. Through strategic placement of relevant industry examples, comparative benchmarks, and outcome-focused narratives, financial presentations transform from data-heavy documents into compelling business stories, with many organizations finding that real-world examples significantly improve stakeholder engagement and decision-making speed.
Interactive dashboards, infographic-style visualizations, story-driven narratives, video presentations, and augmented reality displays offer compelling alternatives to standard financial slides. These formats enhance stakeholder engagement by transforming complex data into digestible visual stories, with many financial institutions finding that interactive elements and narrative structures significantly improve comprehension and decision-making speed.
Presenters can avoid information overload by limiting each slide to one key financial metric, using clear visual hierarchies with whitespace, and breaking complex data into digestible segments across multiple slides. These approaches streamline audience comprehension by emphasizing critical insights, minimizing cognitive burden, and enabling focused discussions, with many financial professionals finding that simplified presentations ultimately deliver stronger stakeholder engagement and faster decision-making outcomes.
Startups benefit most from cash flow projections, funding pitch decks, burn rate trackers, and investor presentation templates that emphasize growth potential and scalability. Established corporations require comprehensive financial dashboards, quarterly earnings reports, budget variance analyses, and stakeholder presentations, with many finding that startups prioritize future projections while corporations focus on historical performance and regulatory compliance.
Presenters should prepare comprehensive backup slides, rehearse key data points thoroughly, and anticipate common concerns about methodology, assumptions, and market conditions. By acknowledging data limitations upfront, providing multiple scenario analyses, and offering detailed appendices with supporting calculations, financial professionals can address stakeholder questions confidently, ultimately building trust and credibility in their recommendations.
**INPUT**: What techniques can be employed to captivate an audience's attention during a financial presentation? **OUTPUT**: Captivating financial presentation techniques include compelling storytelling with data narratives, strategic use of interactive visuals, simplified complex metrics through infographics, audience polling integration, and strategic pauses for emphasis. These approaches enhance engagement by transforming abstract financial concepts into relatable business stories, with many financial professionals finding that combining visual hierarchy with clear value propositions ultimately delivers stronger stakeholder buy-in and decision-making outcomes. **Word count: 60 words**
-
Innovative and attractive designs.
-
Out of the box and creative design.