Financial Investigation Powerpoint Presentation Slides
Our Financial Investigation Powerpoint Presentation Slides are topically designed to provide an attractive backdrop to any subject. Use them to look like a presentation pro.
- Google Slides is a new FREE Presentation software from Google.
- All our content is 100% compatible with Google Slides.
- Just download our designs, and upload them to Google Slides and they will work automatically.
- Amaze your audience with SlideTeam and Google Slides.
-
Want Changes to This PPT Slide? Check out our Presentation Design Services
- WideScreen Aspect ratio is becoming a very popular format. When you download this product, the downloaded ZIP will contain this product in both standard and widescreen format.
-

- Some older products that we have may only be in standard format, but they can easily be converted to widescreen.
- To do this, please open the SlideTeam product in Powerpoint, and go to
- Design ( On the top bar) -> Page Setup -> and select "On-screen Show (16:9)” in the drop down for "Slides Sized for".
- The slide or theme will change to widescreen, and all graphics will adjust automatically. You can similarly convert our content to any other desired screen aspect ratio.
Compatible With Google Slides

Get This In WideScreen
You must be logged in to download this presentation.
PowerPoint presentation slides
Presenting this set of slides with name - Financial Investigation Powerpoint Presentation Slides. This is a one stage process. The stages in this process are Financial Investigation, Forensic Accounting, Financial Analysis.
People who downloaded this PowerPoint presentation also viewed the following :
Content of this Powerpoint Presentation
Slide 1: This slide introduces Financial Investigation. State Your Company Name and begin.
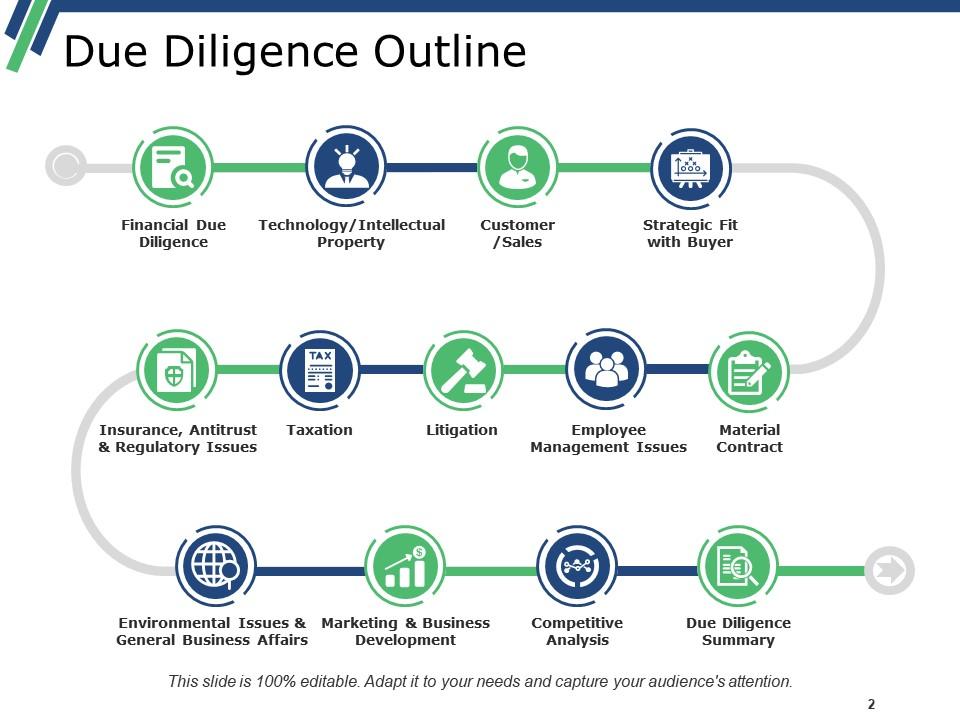
Slide 2: This slide presents Due Diligence Outline with these process stages- Environmental Issues & General Business Affairs, Marketing & Business Development, Competitive Analysis, Due Diligence Summary, Financial Due Diligence, Technology/Intellectual Property, Customer/Sales, Strategic Fit with Buyer, Insurance, Antitrust & Regulatory Issues, Taxation, Litigation, Employee Management Issues, Material Contract.
Slide 3: This slide showcases Financial Due Diligence for proceding further.
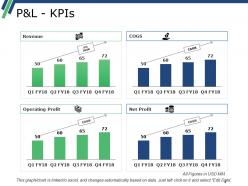
Slide 4: This slide shows P&L - KPIs. You can add the revenue and net profit.
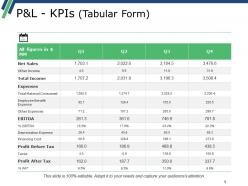
Slide 5: This slide presents P&L - KPIs (Tabular Form).
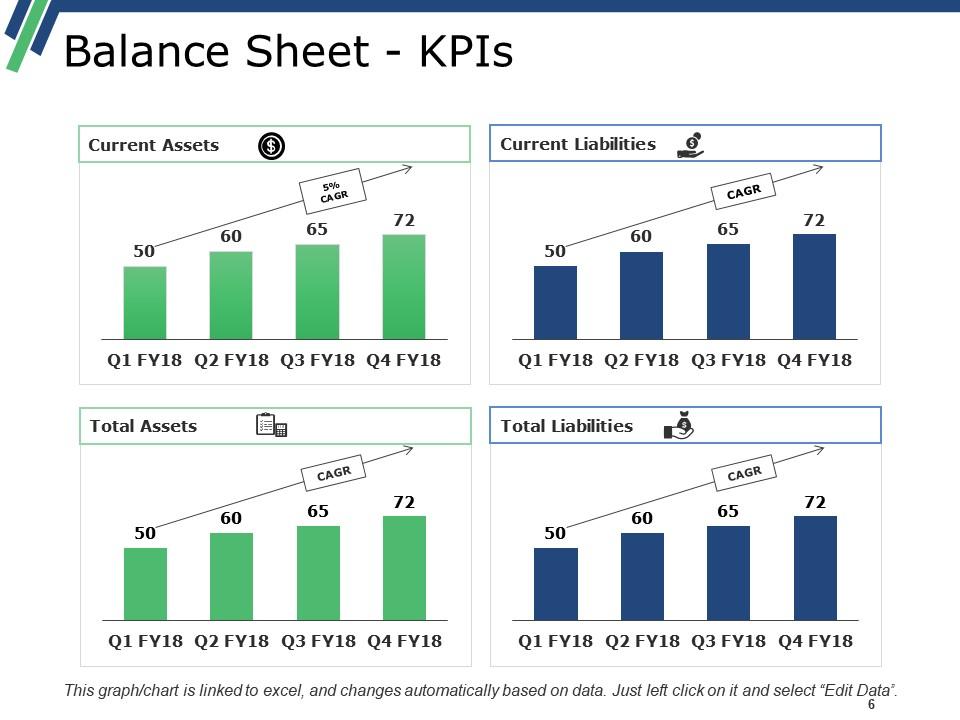
Slide 6: This slide showcases Balance Sheet - KPIs with four of the bar chart.
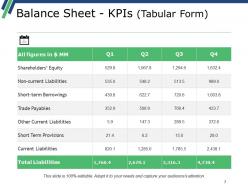
Slide 7: This slide shows Balance Sheet - KPIs (Tabular Form ). You can add the data and use it.
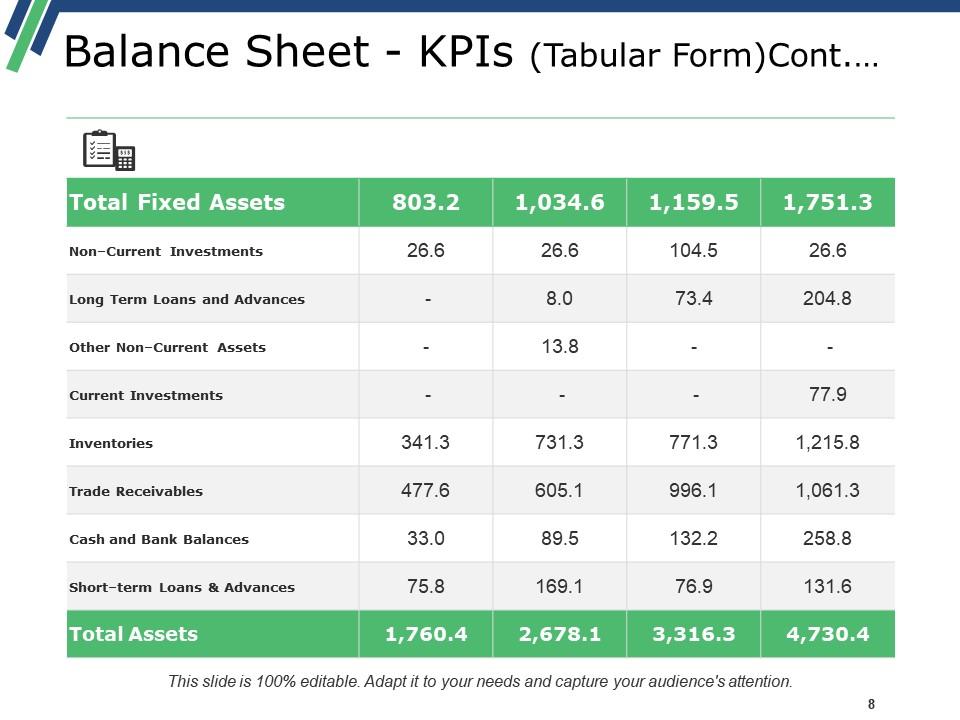
Slide 8: This slide presents Balance Sheet - KPIs (Tabular Form) Continuation.
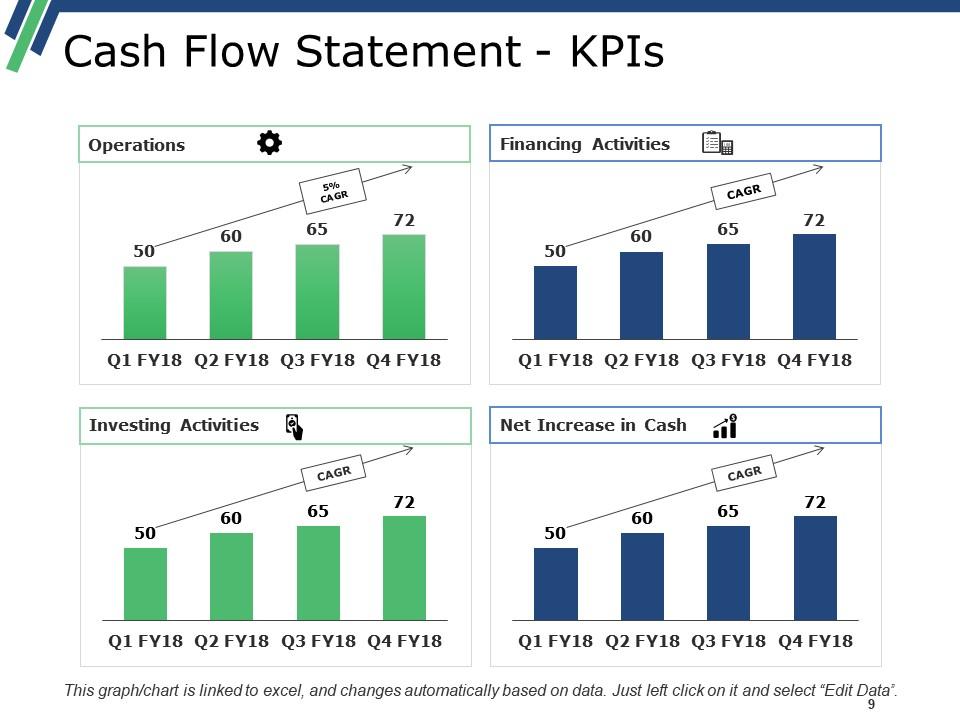
Slide 9: This slide showcases Cash Flow Statement - KPIs with these four important parameters- Operations, Net Increase in Cash, Investing Activities, Financing Activities.
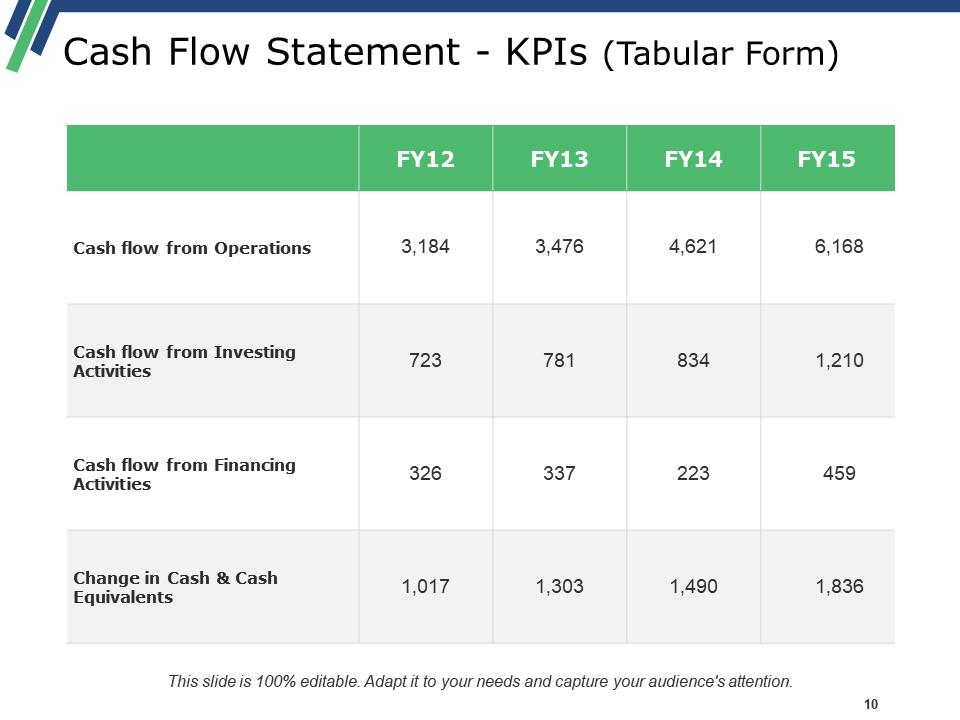
Slide 10: This slide presents Cash Flow Statement - KPIs (Tabular Form). You can add the details for the four financial years.
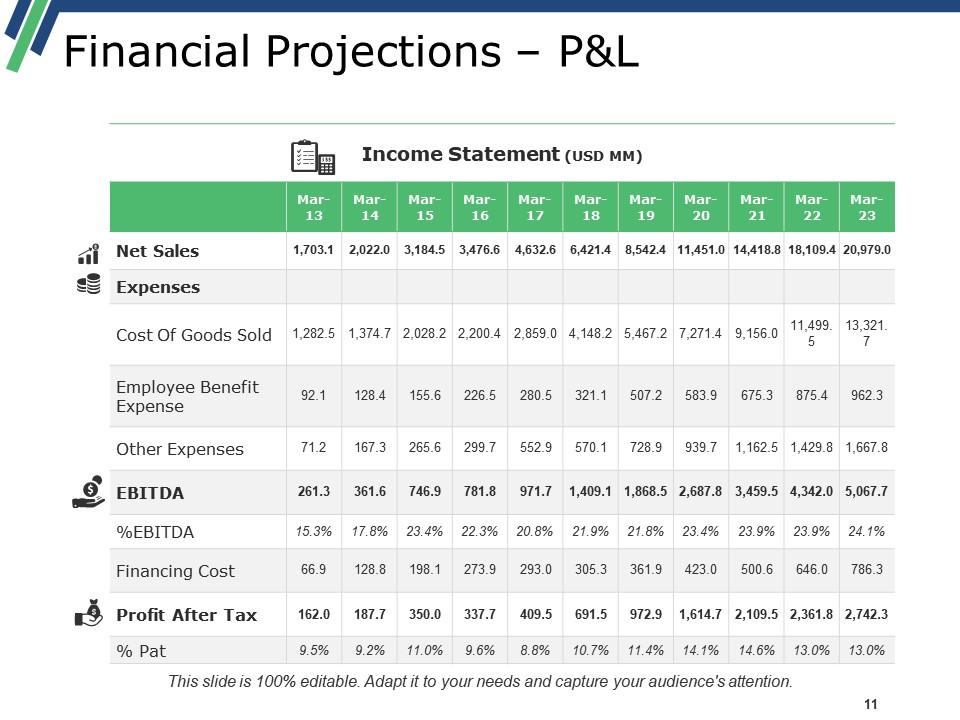
Slide 11: This slide shows Financial Projections – P&L with the parameters we have shown in table.
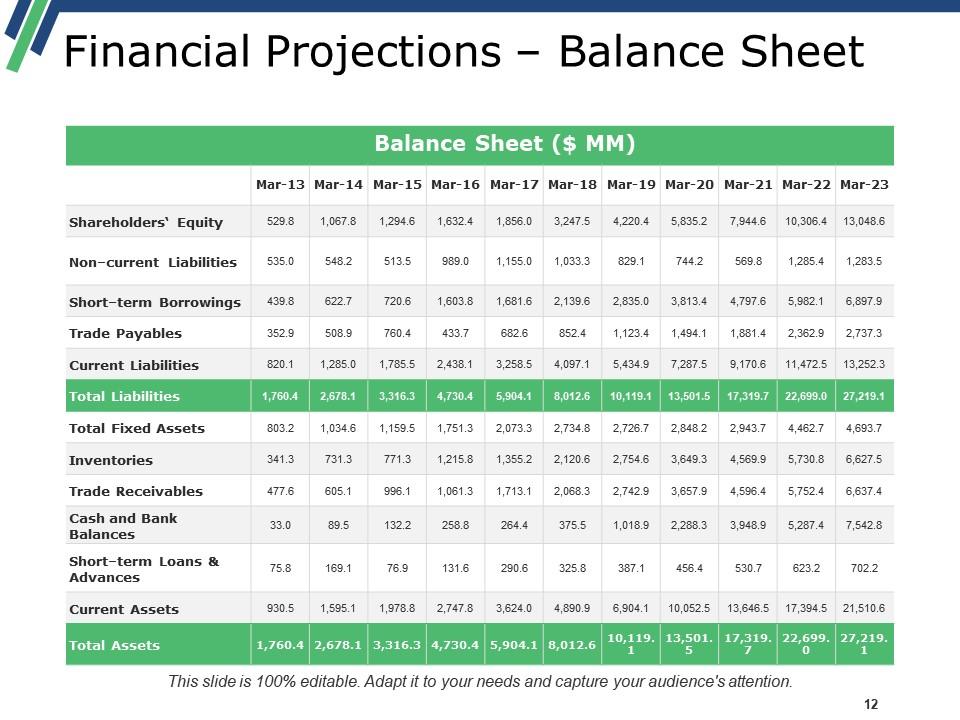
Slide 12: This slide presents Financial Projections – Balance Sheet.
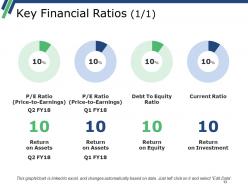
Slide 13: This slide showcases Key Financial Ratios (1/1). You can use this to add finacial percentages.
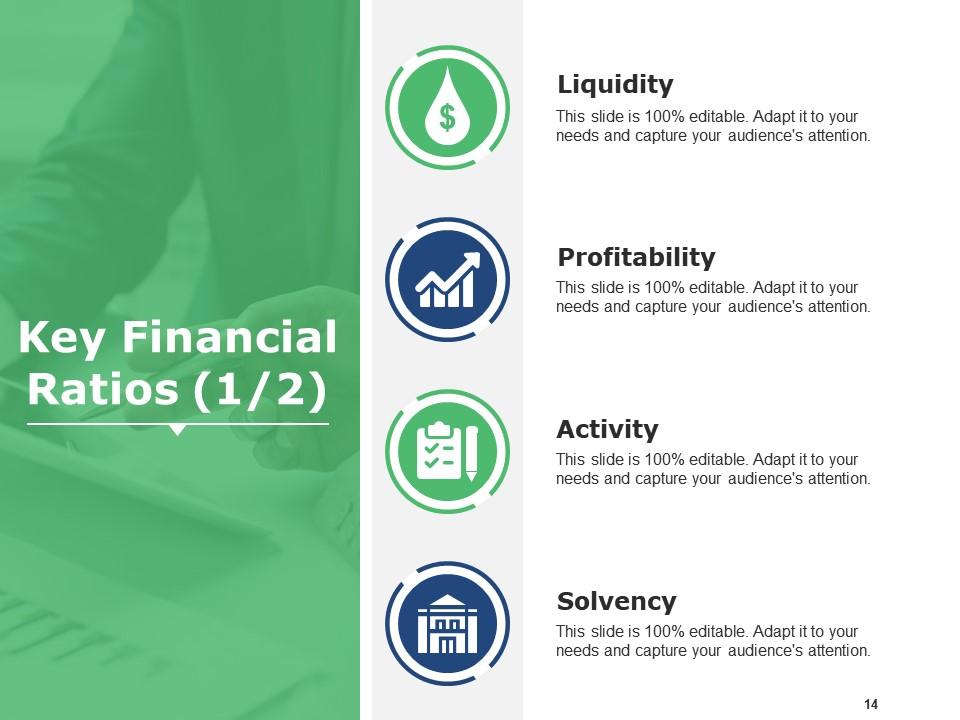
Slide 14: This slide presents Key Financial Ratios (1/2) with these four stages- Liquidity, Profitability, Activity, Solvency.
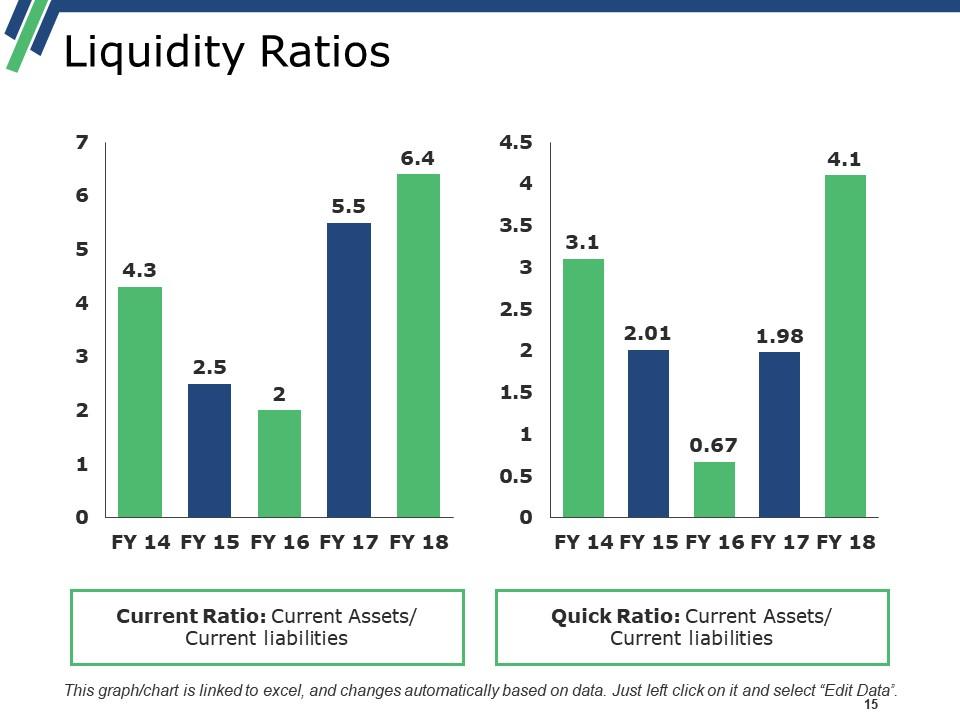
Slide 15: This slide presents Liquidity Ratios with these two main criteria- Current Ratio: Current Assets/ Current liabilities, Quick Ratio: Current Assets/ Current liabilities.
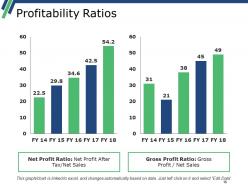
Slide 16: This slide showcases Profitability Ratios with these of the two parameter- Net Profit Ratio: Net Profit After Tax/Net Sales, Gross Profit Ratio: Gross Profit / Net Sales.
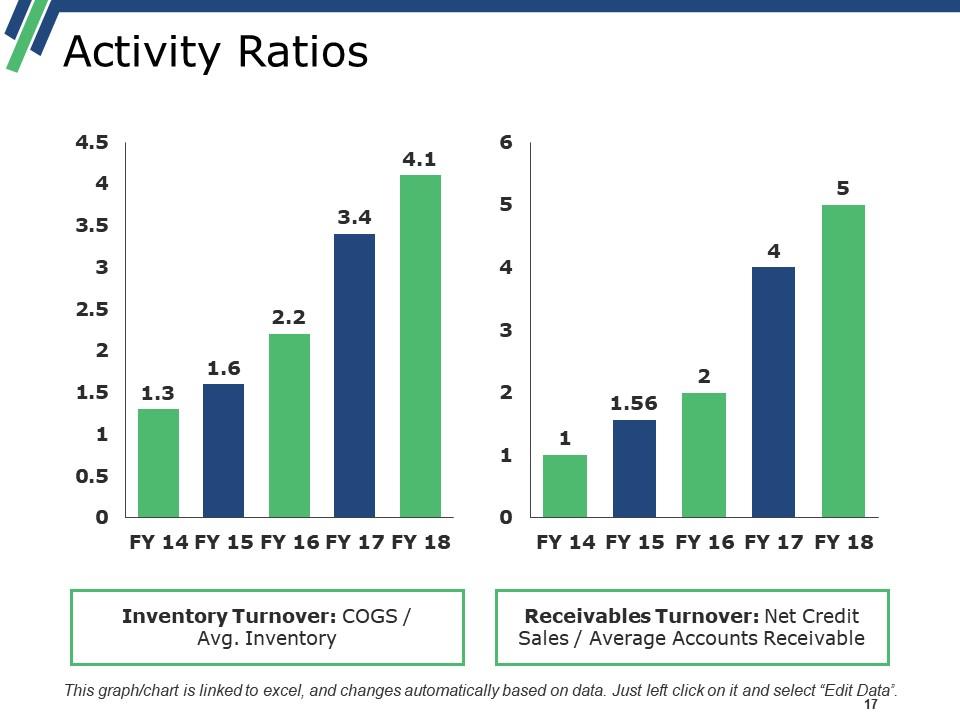
Slide 17: This slide shows Activity Ratios which further includes- Inventory Turnover: COGS / Avg. Inventory, Receivables Turnover: Net Credit Sales / Average Accounts Receivable.
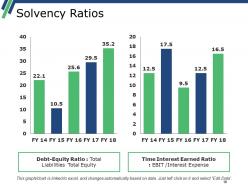
Slide 18: This slide presents Solvency Ratios with these two important factors- Debt-Equity Ratio : Total Liabilities Total Equity, Time Interest Earned Ratio : EBIT /Interest Expense.
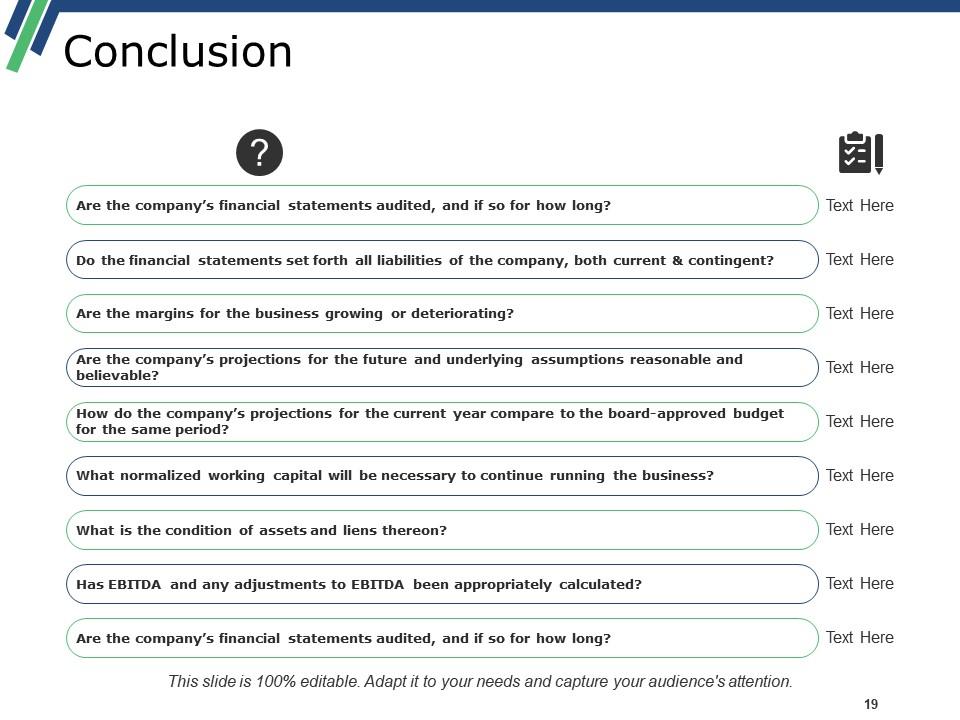
Slide 19: This slide shows Conclusion with these we have shown as listed.
Slide 20: This slide presents Technology/Intellectual Property.
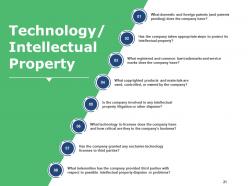
Slide 21: This slides showcases Technology/Intellectual Property.
Slide 22: This slide presents Customer/Sales. Add and use it accordingly.
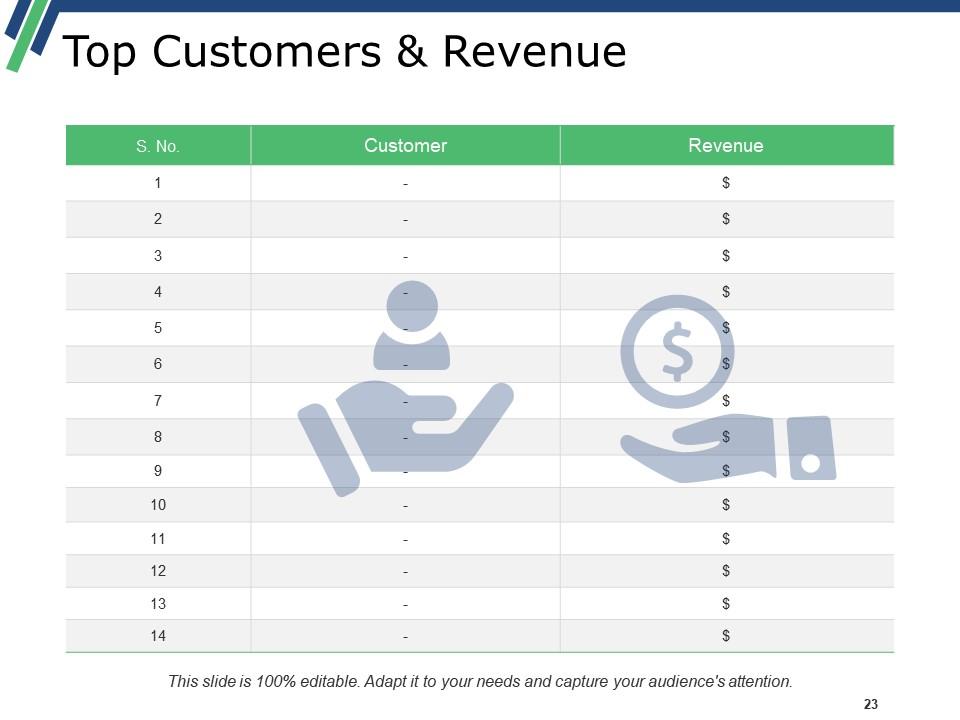
Slide 23: This slide showcases Top Customers & Revenue with a table.
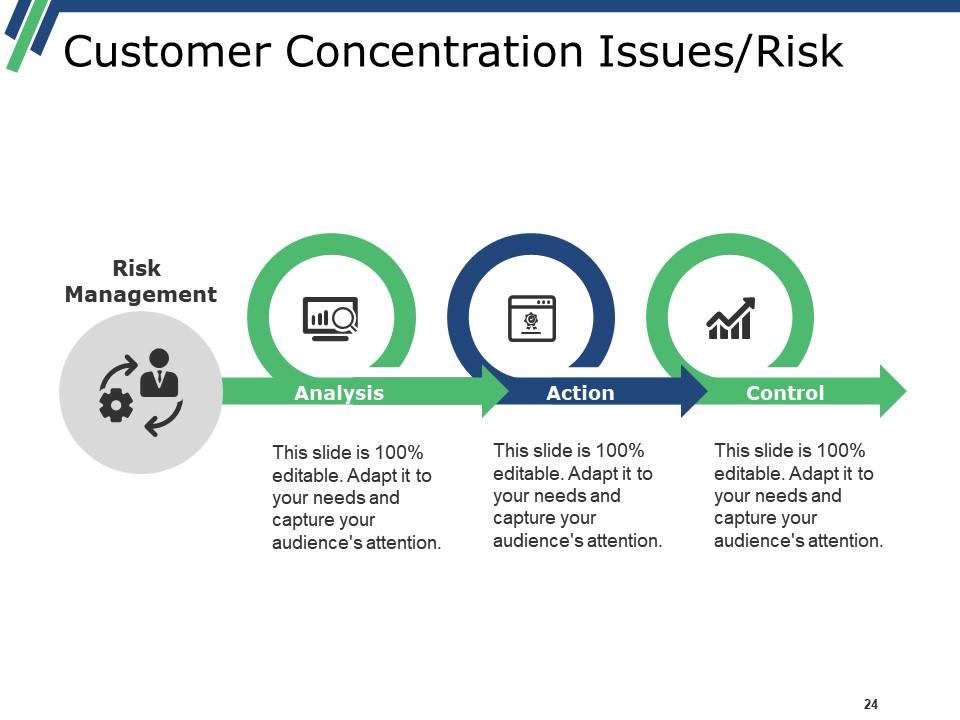
Slide 24: This slide presents Customer Concentration Issues/Risk with these important points- Risk Management, Action, Control, Analysis.
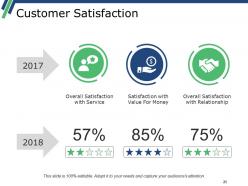
Slide 25: This slide showcases Customer Satisfaction with the percentage.
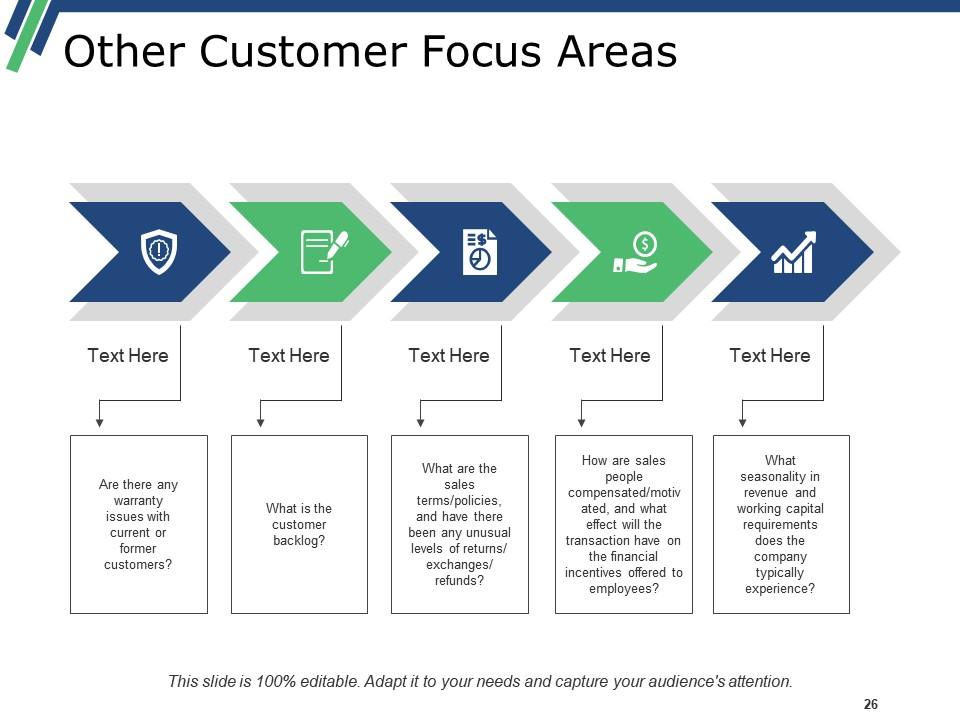
Slide 26: This slide presents Other Customer Focus Areas with these of the areas we have taken- Are there any warranty issues with current or former customers, What is the customer backlog, What are the sales terms/policies, and have there been any unusual levels of returns/ exchanges/ refunds, How are sales people compensated/motivated, and what effect will the transaction have on the financial incentives offered to employees, What seasonality in revenue and working capital requirements does the company typically experience.
Slide 27: This slide showcases Strategic Fit With Buyer.
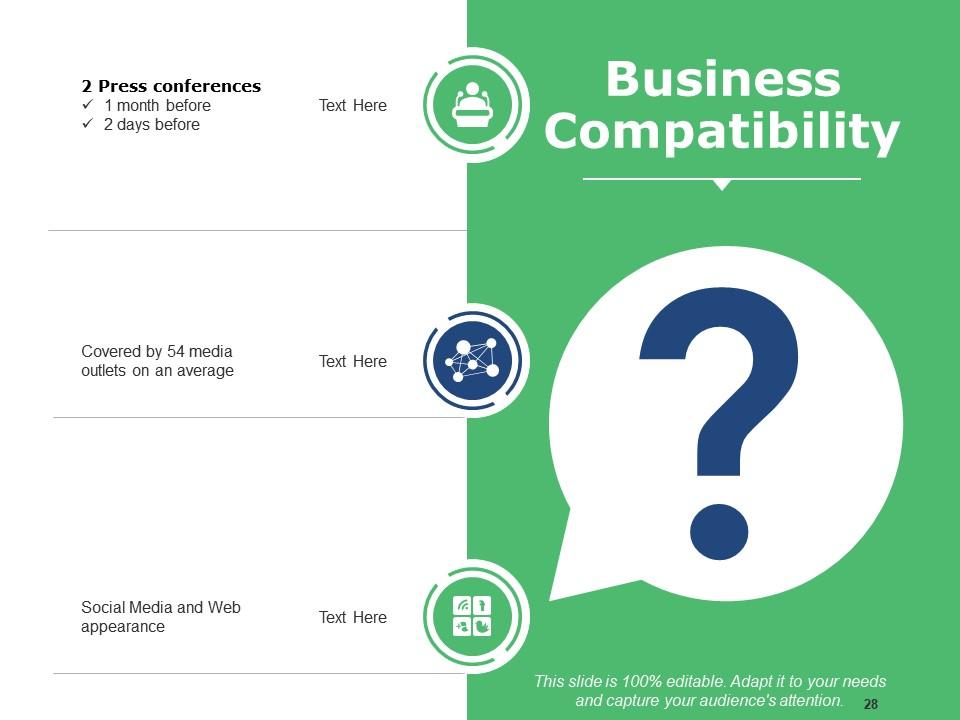
Slide 28: This slide presents Business Compatibility.
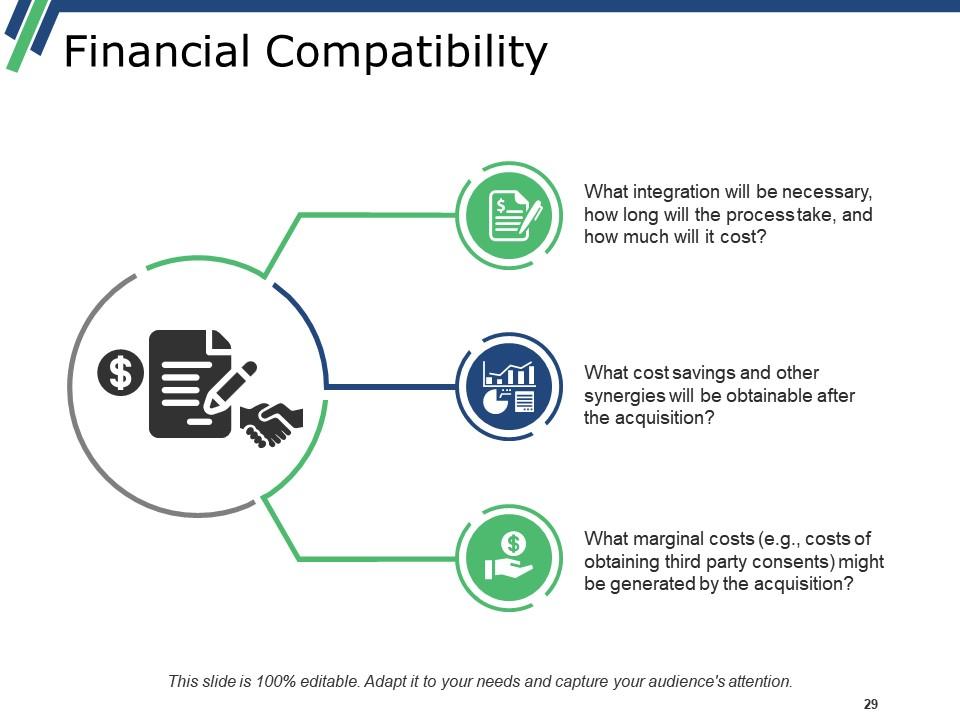
Slide 29: This slide showcases Financial Compatibility with three of the factors.
Slide 30: This slide displays Material Contract.
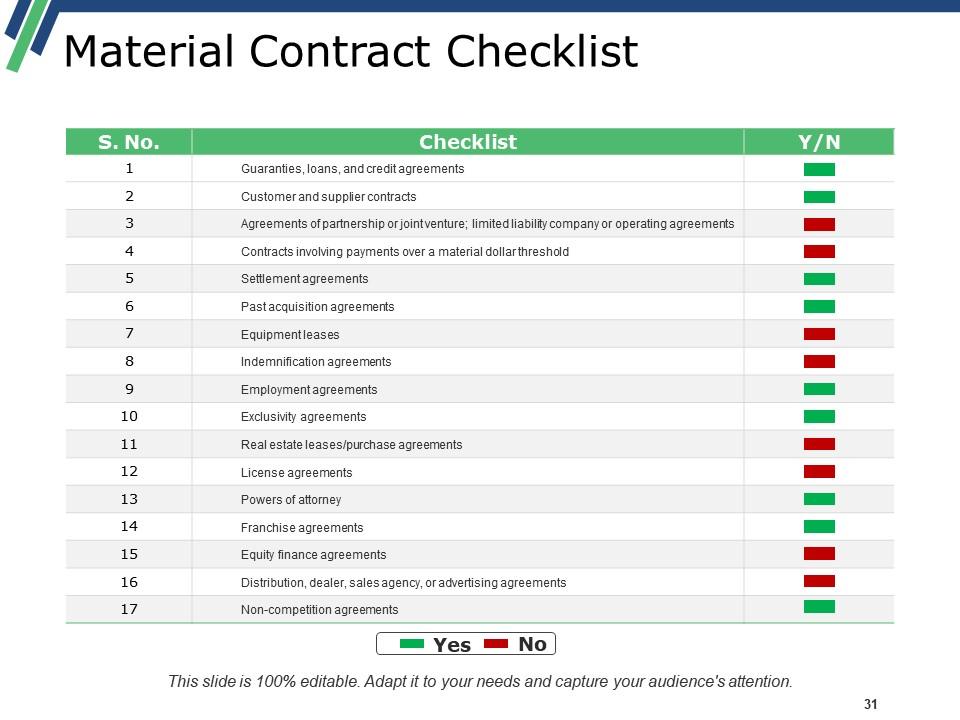
Slide 31: This slide presents Material Contract Checklist.
Slide 32: This slide shows Employee Management Issues.
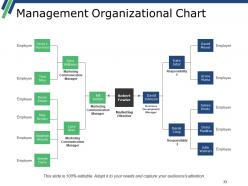
Slide 33: This slide presents Management Organizational Chart with which you can add the company team.
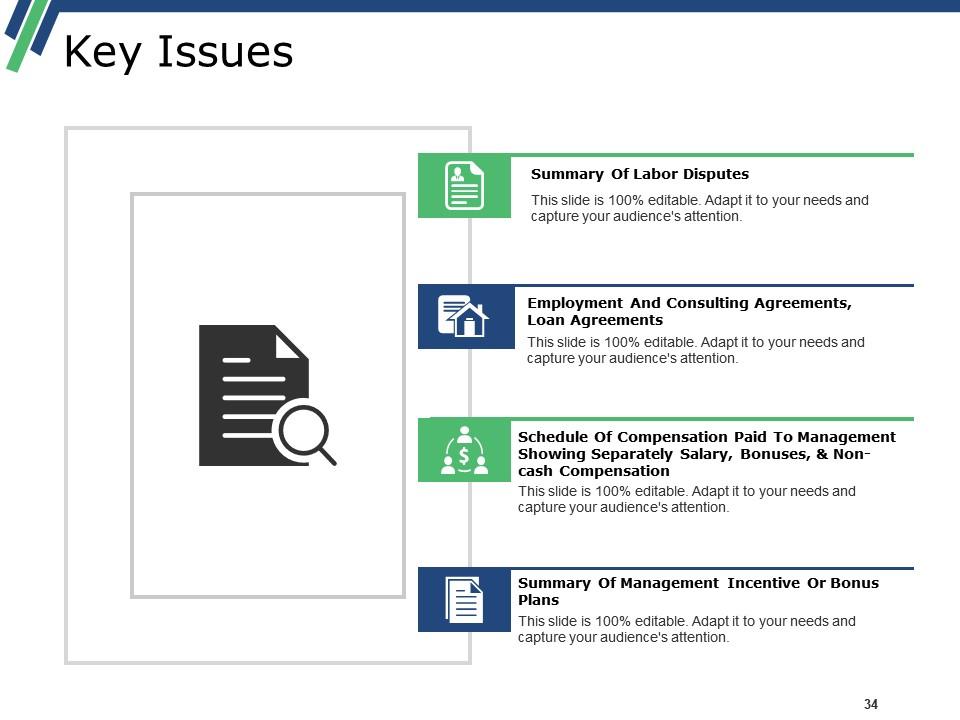
Slide 34: This slide shows Key Issues with these parameters- Summary Of Labor Disputes, Employment And Consulting Agreements, Loan Agreements, Schedule Of Compensation Paid To Management Showing Separately Salary, Bonuses, & Non-cash Compensation, Summary Of Management Incentive Or Bonus Plans.
Slide 35: This slide showcases Litigation.
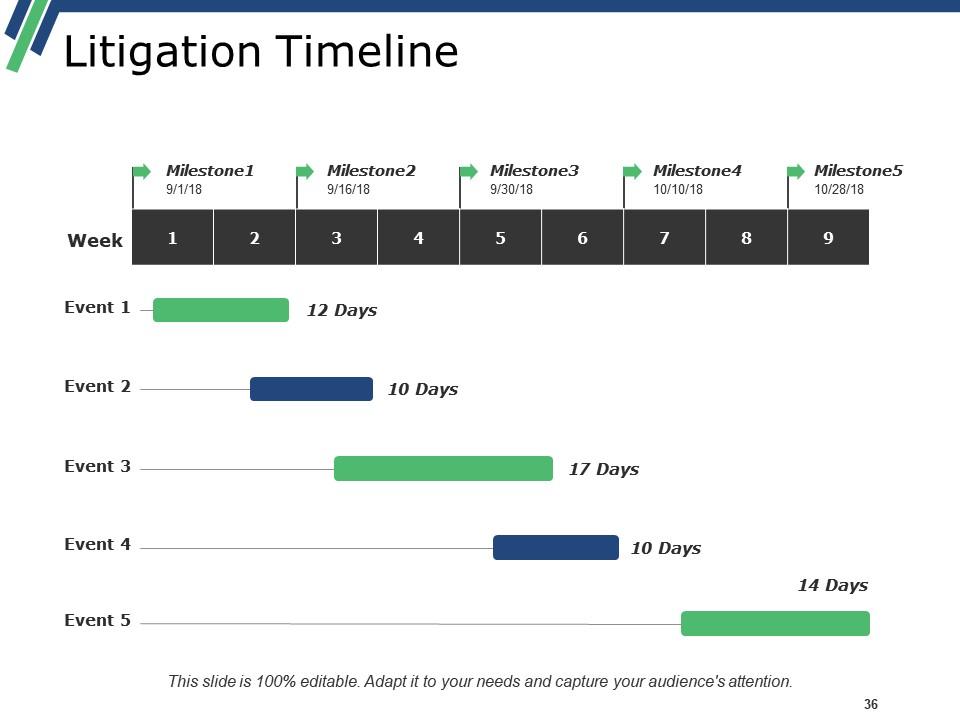
Slide 36: This slide shows Litigation Timeline with milestone.
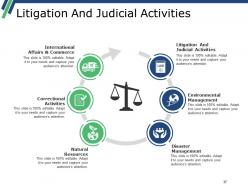
Slide 37: This slide showcases Litigation And Judicial Activities with these of the factors- Environmental Management, Disaster Management, International Affairs & Commerce, Correctional Activities, Natural Resources.
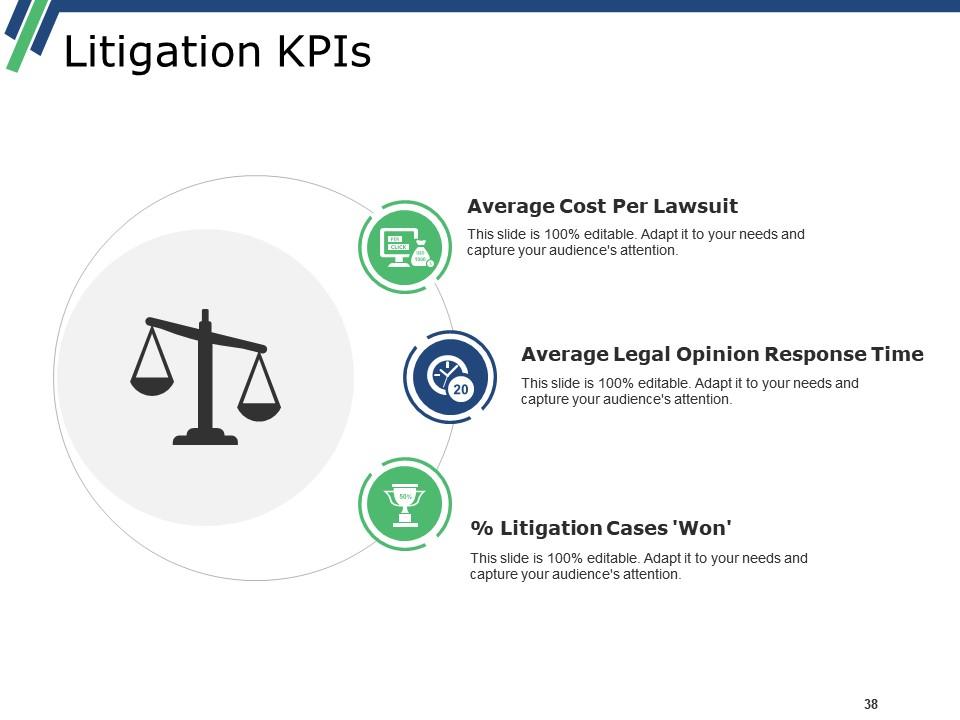
Slide 38: This slide presents Litigation KPIs with these of the factors listed- Average Cost Per Lawsuit, Average Legal Opinion Response Time, % Litigation Cases 'Won'.
Slide 39: This slide shows Taxation.
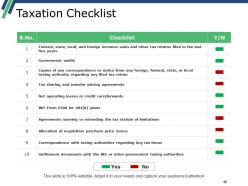
Slide 40: This slide presents Taxation Checklist with a number of the criterias we have listed.
Slide 41: This slide showcases Insurance, Antitrust & Regulatory Issues.
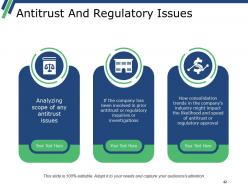
Slide 42: This slide shows Antitrust And Regulatory Issues with these of the factors we have listed- Analyzing scope of any antitrust issues, If the company has been involved in prior antitrust or regulatory inquiries or investigations, How consolidation trends in the company’s industry might impact the likelihood and speed of antitrust or regulatory approval.
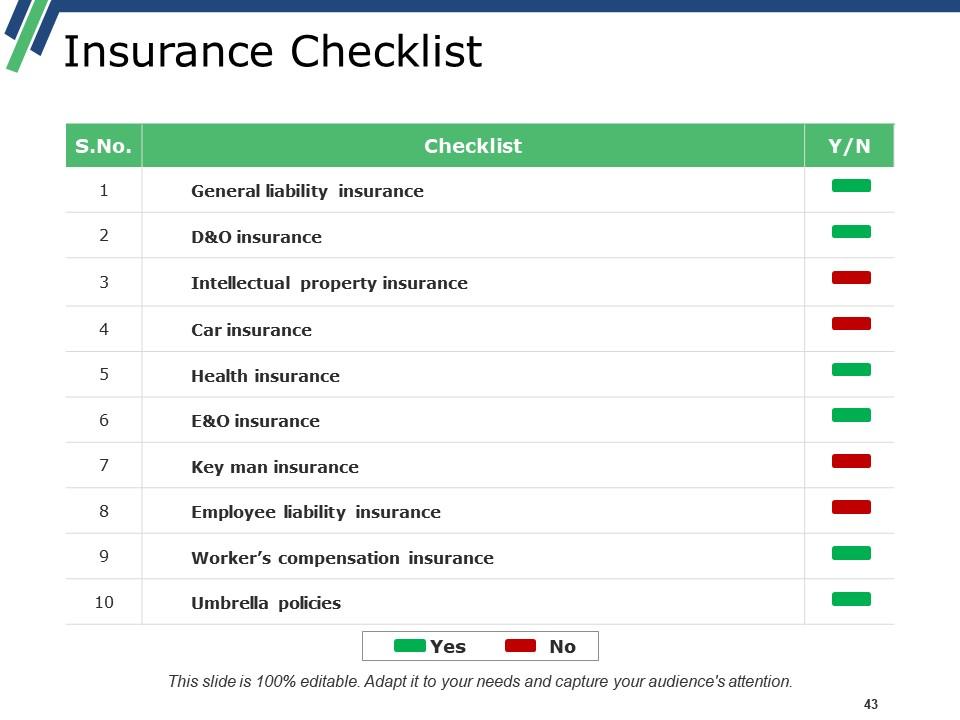
Slide 43: This slide presents Insurance Checklist with these points we have listed.
Slide 44: This slide showcases Environmental Issues & General Business Affairs.
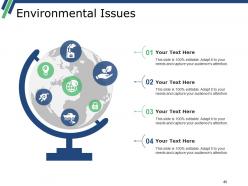
Slide 45: This slide presents Environmental Issues.
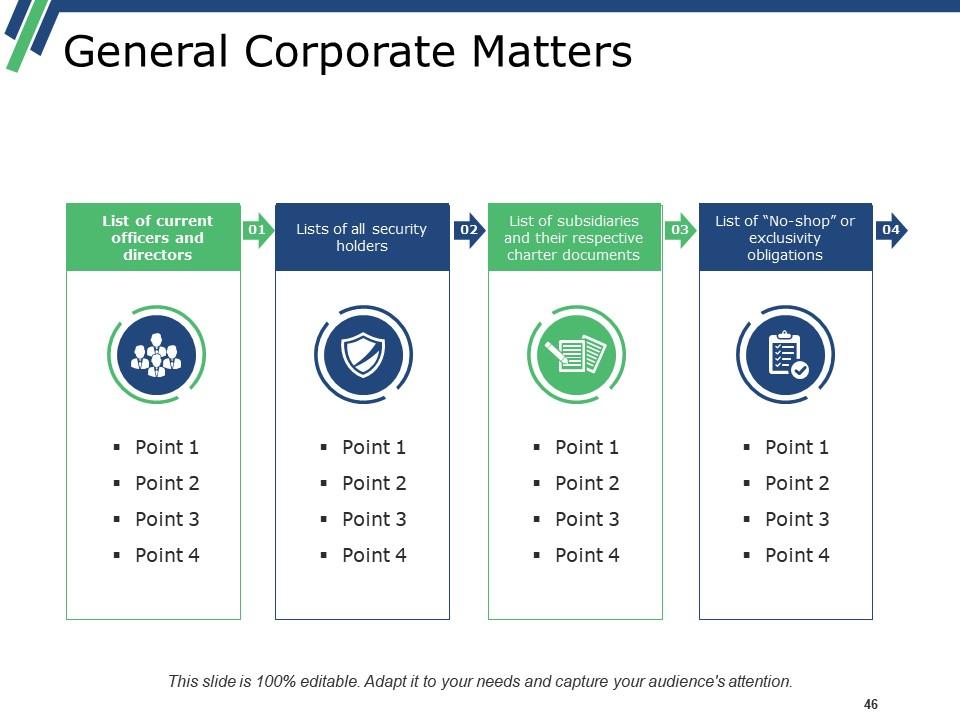
Slide 46: This slide showcases General Corporate Matters.
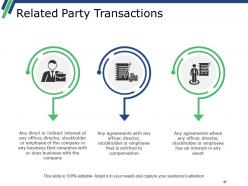
Slide 47: This slide presents Related Party Transactions.
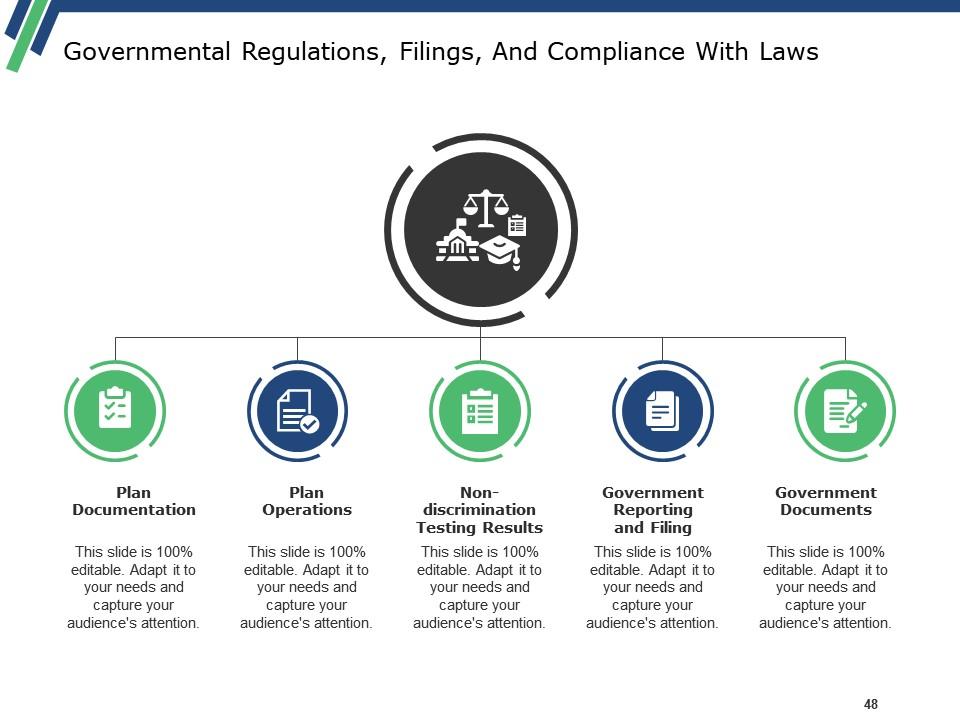
Slide 48: This slide shows Governmental Regulations, Filings, And Compliance With Laws which further showcases- Plan Operations, Plan Documentation, Non-discrimination, Testing Results, Government Reporting and Filing, Government Documents.
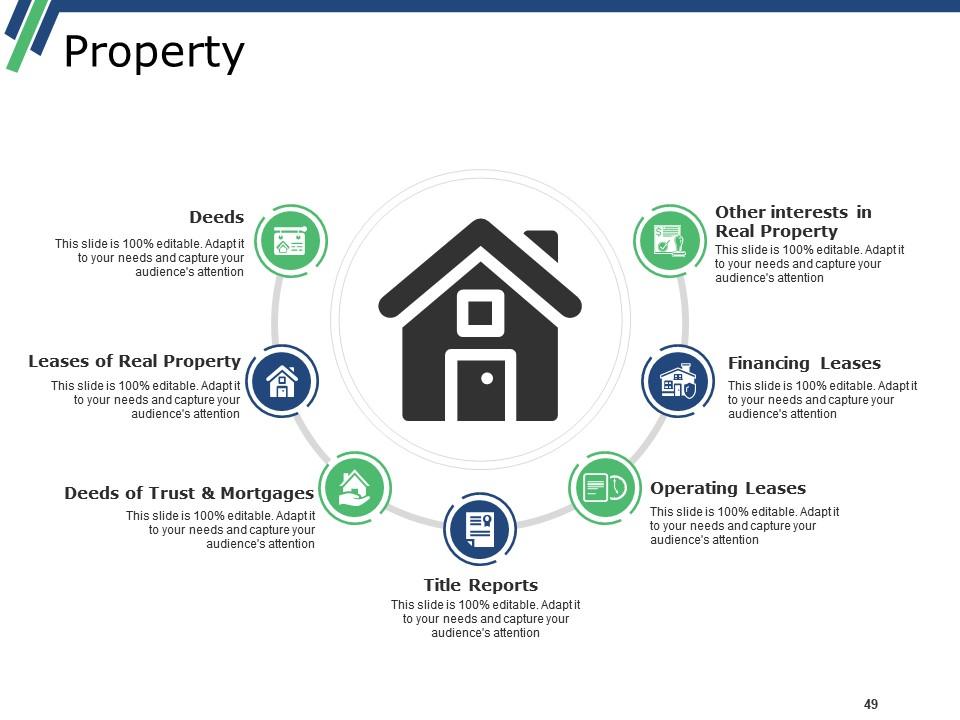
Slide 49: This slide displays Property Title Reports, Other interests in Real Property, Financing Leases, Operating Leases, Deeds, Deeds of Trust & Mortgages, Leases of Real Property.
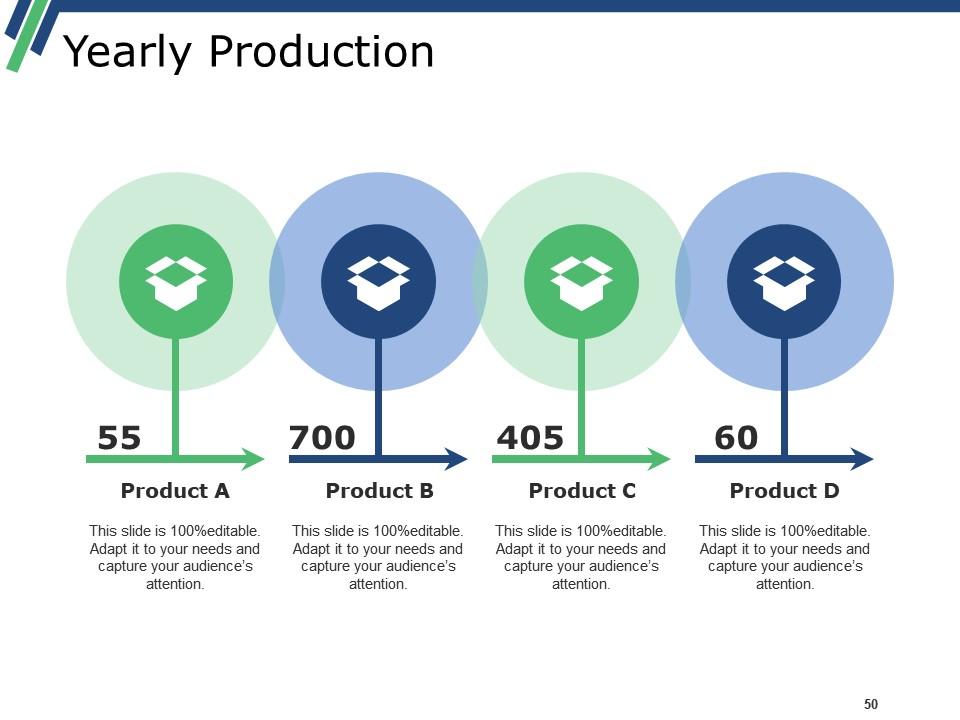
Slide 50: This slide showcases Yearly Production with four of the product we have listed.
Slide 51: This slide presents Marketing & Business Development to forward further.
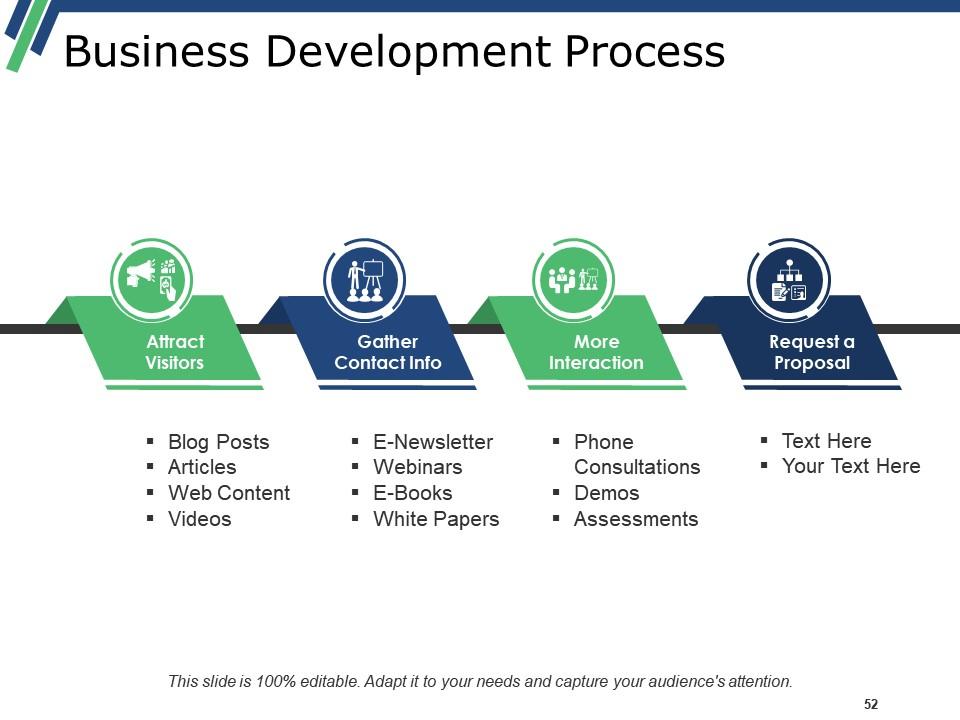
Slide 52: This slide shows Business Development Process with these four main stages- Attract Visitors, Gather Contact Info, More Interaction, Request a Proposal.
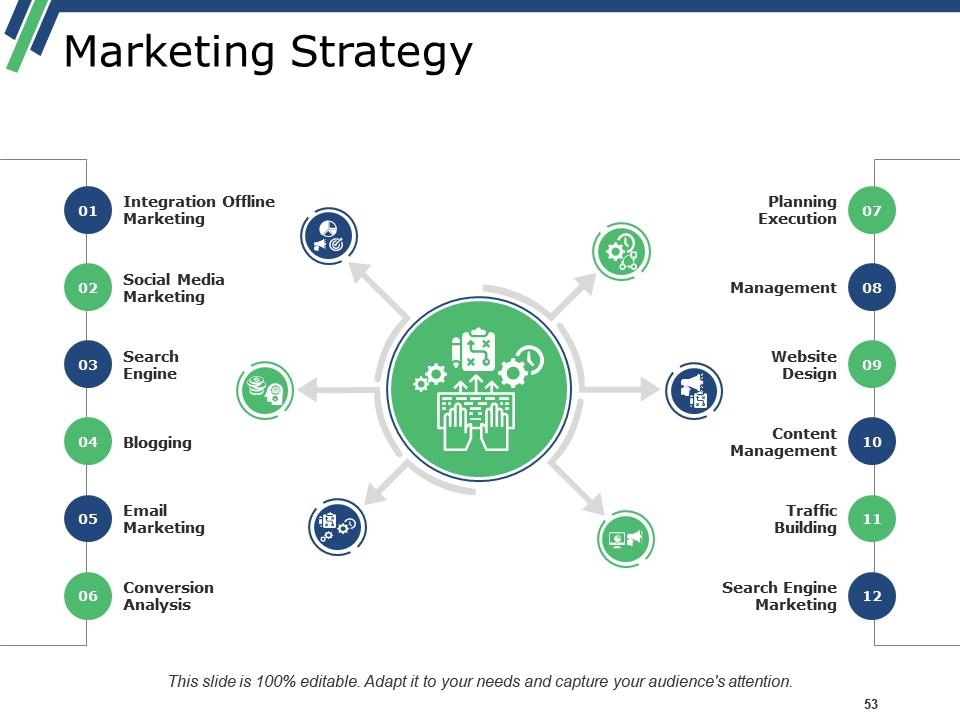
Slide 53: This slide presents Marketing Strategy with these main functions- Management, Website Design, Content Management, Traffic Building, Search Engine Marketing, Planning Execution, Social Media Marketing, Search Engine, Blogging, Email Marketing, Conversion Analysis, Integration Offline Marketing.
Slide 54: This slide showcases Competitive Analysis.
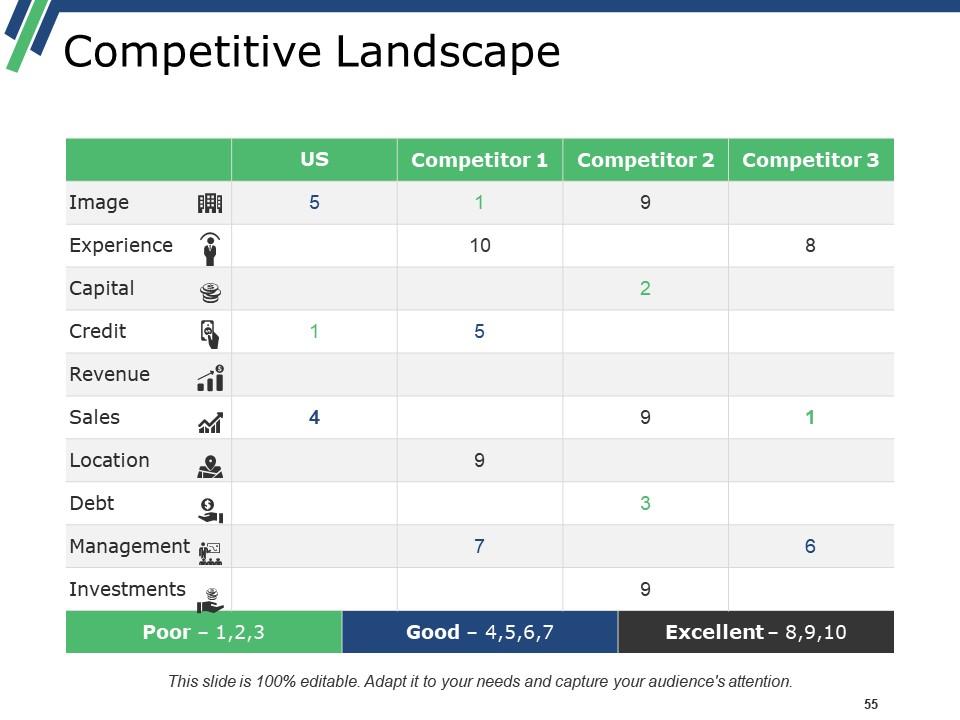
Slide 55: This slide presents Competitive Landscape table with some of the parameters.
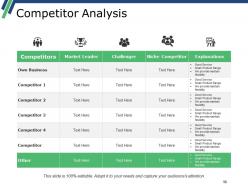
Slide 56: This slide showcases Competitor Analysis which further shows the market leader.
Slide 57: This slide presents Summary for further.
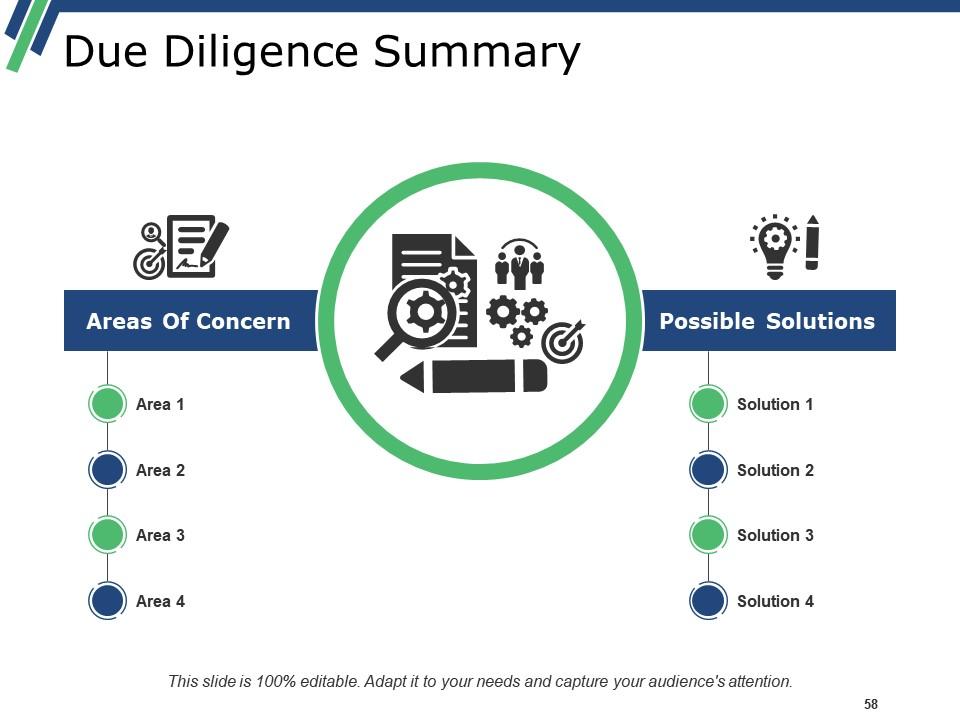
Slide 58: This slide showcases Due Diligence Summary with areas and solution.
Slide 59: This slide is a Coffee Break image for a halt.
Slide 60: This slide forwards to Charts & Graphs.
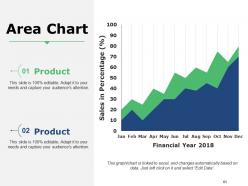
Slide 61: This is an Area Chart slide for product/entity comparison.
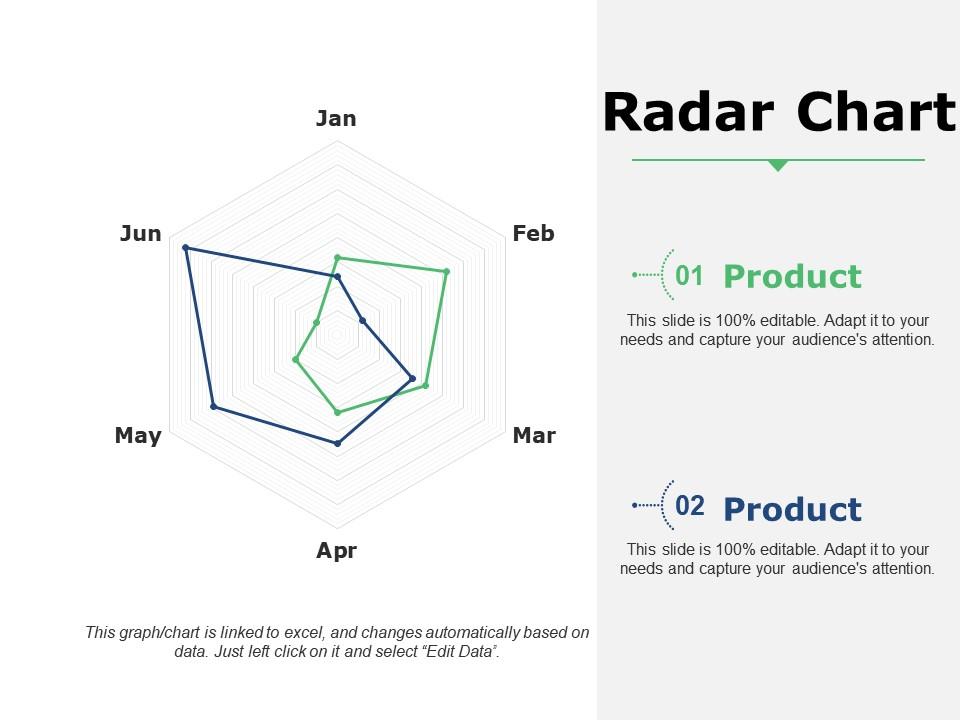
Slide 62: This is a Radar Chart slide for product/entity comparison.
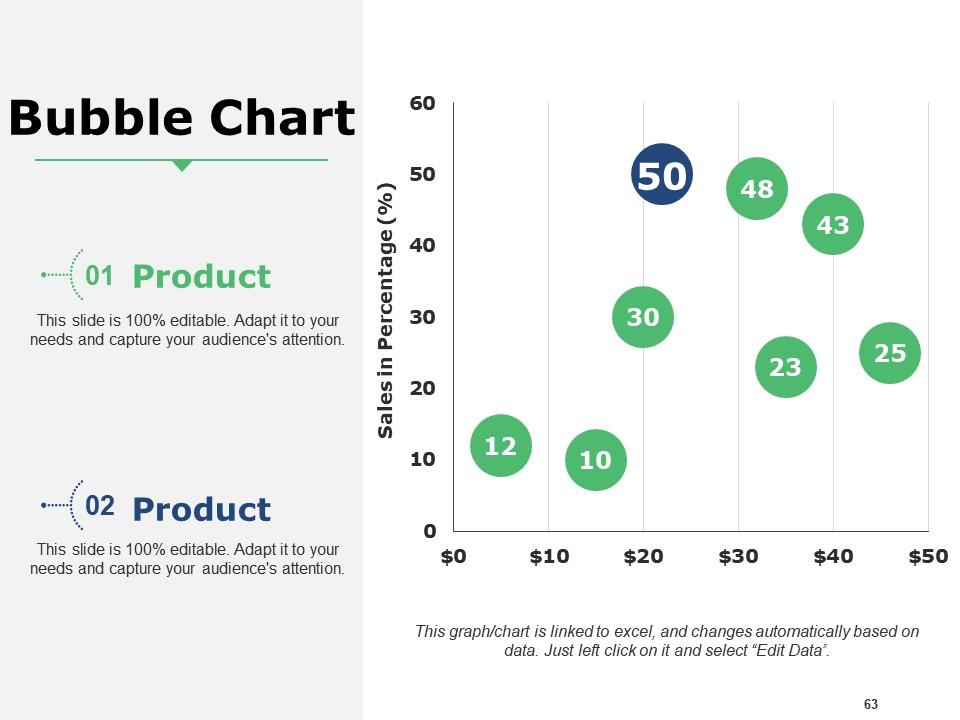
Slide 63: This slide showcases Bubble Chart with which you can use it for the product comparison.
Slide 64: This slide is titled Additional Slides.
Slide 65: This slide represents Our Mission. State your mission, goals et
Slide 66: This slide showcases Our Team with Name and Designation to fill.
Slide 67: This slide helps show- About Our Company. The sub headings include- Creative Design, Customer Care, Expand Company.
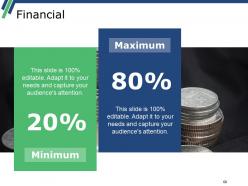
Slide 68: This slide presents Financial scores to display.
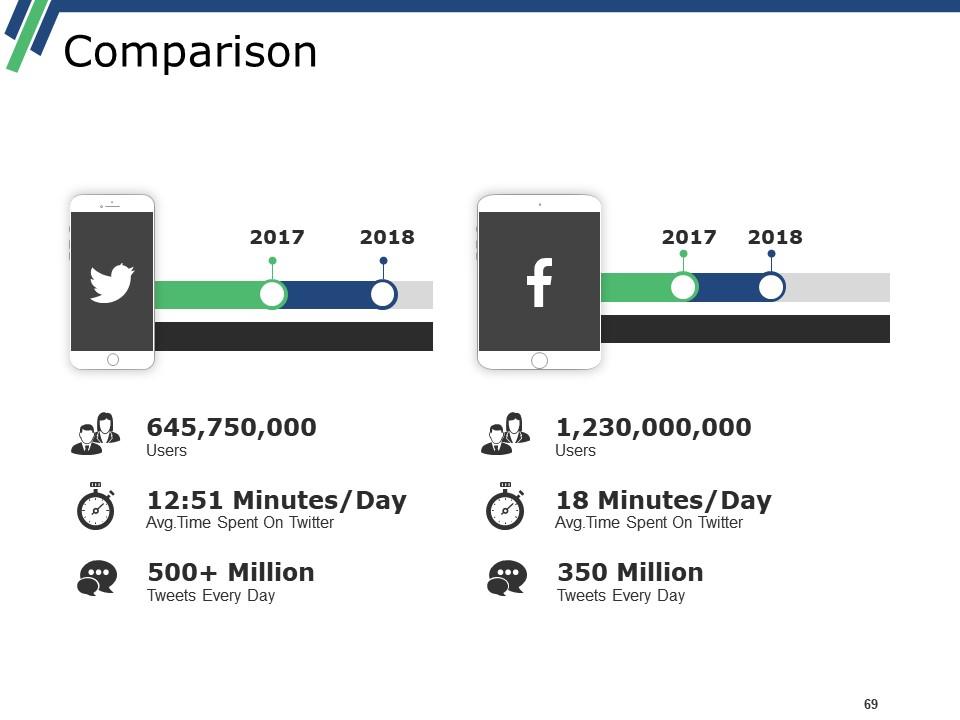
Slide 69: This slide shows Comparison of Positive Factors v/s Negative Factors with thumbsup and thumb down imagery.
Slide 70: This is a Puzzle image slide to show information, specification etc.
Slide 71: This slide displays Our Target with a background image.
Slide 72: This slide shows a Mind map for representing entities.
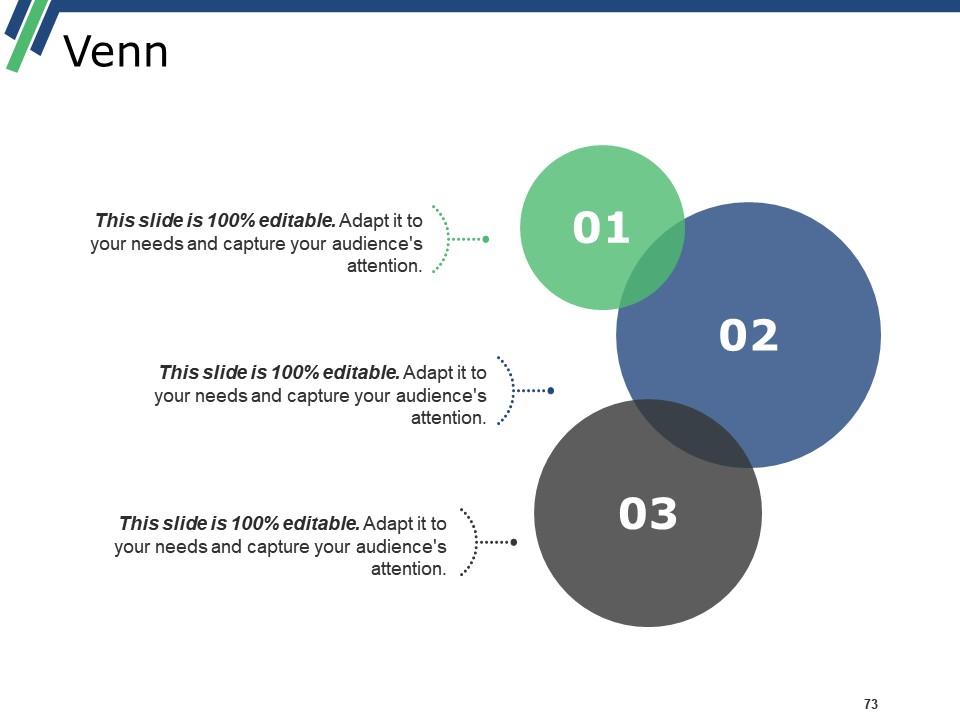
Slide 73: This is a Venn diagram slide to show information etc.
Slide 74: This slide displays a Magnifying Glass with icon imagery.
Slide 75: This is a Bulb or Idea slide to state a new idea or highlight specifications/information etc.
Slide 76: This is a Thank You slide with image.
Financial Investigation Powerpoint Presentation Slides with all 76 slides:
Use our Financial Investigation Powerpoint Presentation Slides to effectively help you save your valuable time. They are readymade to fit into any presentation structure.
-
Use of icon with content is very relateable, informative and appealing.
-
Thanks for all your great templates they have saved me lots of time and accelerate my presentations. Great product, keep them up!
-
Awesome use of colors and designs in product templates.
-
Appreciate the research and its presentable format.
-
Unique and attractive product design.
-
Editable templates with innovative design and color combination.


