


Finland powerpoint maps




Try Before you Buy Download Free Sample Product
 Impress Your
 Audience
 100%
100% Editable
 Save Hours
 of Time


Change is a certainty in the future. Our PT& enable you to benefit from it.
People who downloaded this PowerPoint presentation also viewed the following :
Finland powerpoint maps with all 64 slides:
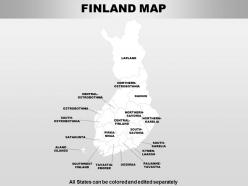
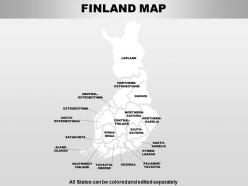
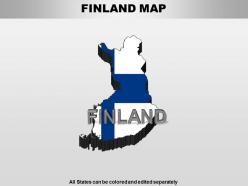
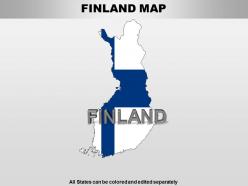
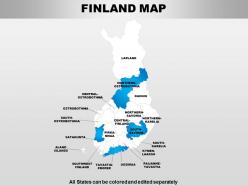
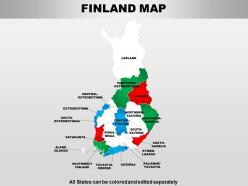
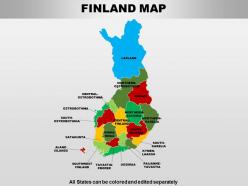
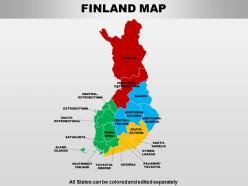
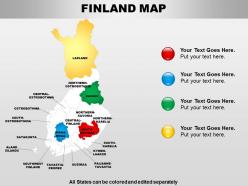
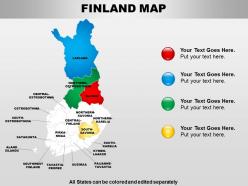
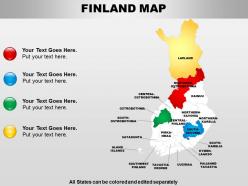
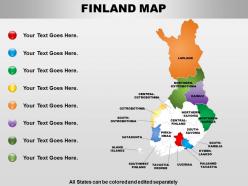
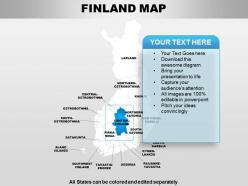
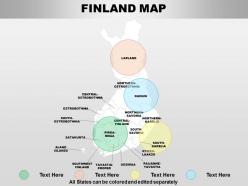
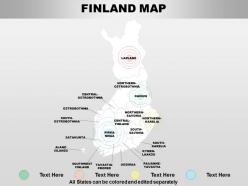
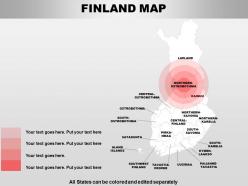
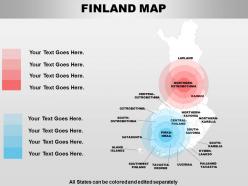
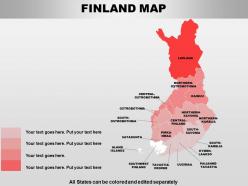
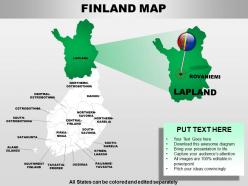
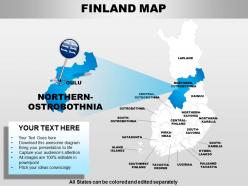
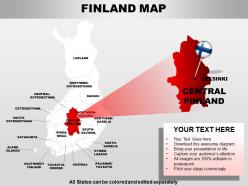
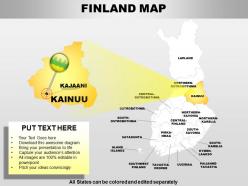
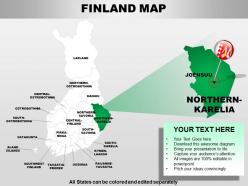
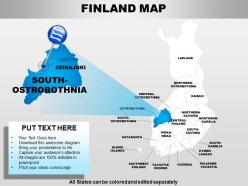
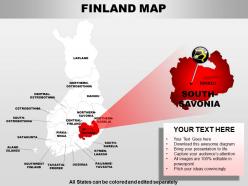
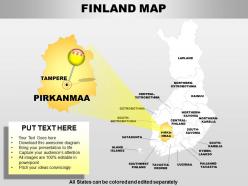
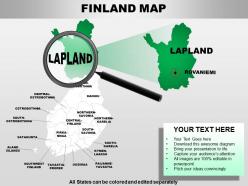
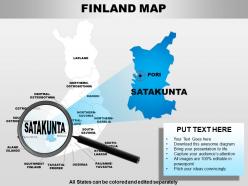
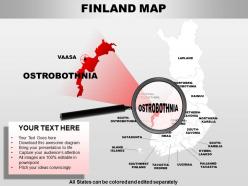
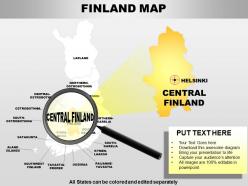
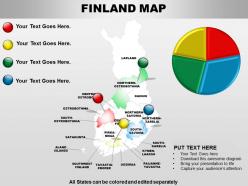
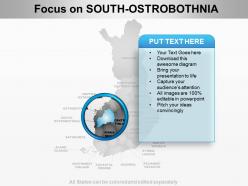
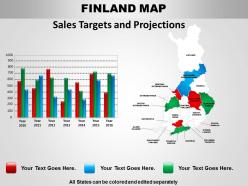
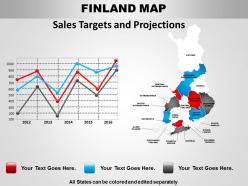
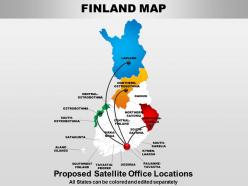
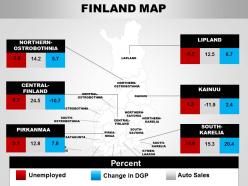
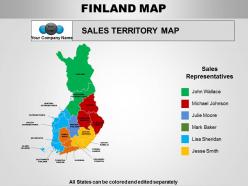
Excite grey cells with our Finland Powerpoint Maps. Get them bubbling with energetic ideas.
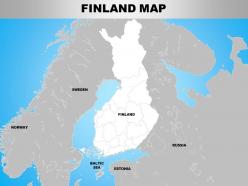
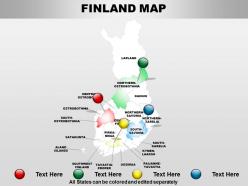
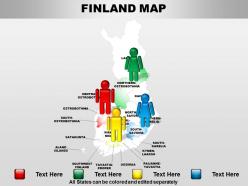
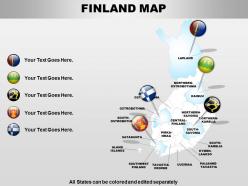
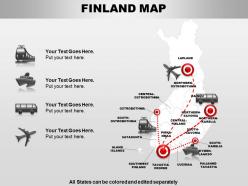
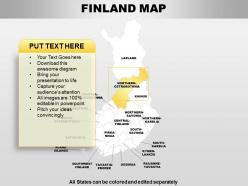
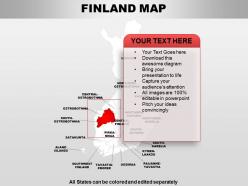
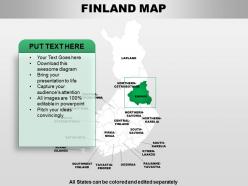
FAQs for
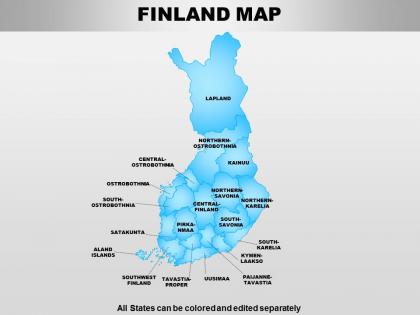
Finland's geography is commonly represented through topographical maps, political boundary maps, climate zone maps, population density maps, and natural resource distribution maps. These cartographic tools enhance understanding by highlighting Finland's extensive forests, thousands of lakes, and Arctic regions, with many educational institutions and government agencies finding that combining multiple map types delivers comprehensive geographic insights for research and planning purposes.
Topographical maps of Finland showcase its distinctive terrain through elevation contours, water body markers, and forest density indicators that reveal the country's lake-rich lowlands, rolling hills, and extensive boreal forests. These detailed cartographic representations enable outdoor enthusiasts, urban planners, and environmental researchers to navigate Finland's archipelagos and wilderness areas effectively, while supporting sustainable tourism development and resource management across this uniquely diverse Nordic landscape.
A thematic map of Finland showcasing cultural diversity should include linguistic regions (Finnish, Swedish, Sami areas), traditional cultural boundaries, population density variations, religious distributions, and ethnic minority concentrations. These elements enable organizations, educational institutions, and tourism boards to streamline cultural understanding while delivering comprehensive insights into Finland's multicultural landscape, ultimately enhancing targeted outreach and inclusive planning strategies.
Historical maps of Finland reveal dramatic political transformations, from Swedish rule through Russian autonomy to independence, showing evolving borders, administrative divisions, and territorial losses after wars. These cartographic records document Finland's changing sovereignty through shifting boundary lines, language designations, and administrative structures, with many historians finding that maps provide unique visual evidence of how geopolitical pressures ultimately shaped modern Finnish national identity.
Digital mapping technologies enhance Finland's urban planning through GIS analytics, 3D modeling, real-time data integration, predictive simulation tools, and interactive visualization platforms. These technologies streamline resource allocation, traffic flow optimization, and infrastructure development by enabling planners to analyze population density patterns, environmental impacts, and service accessibility, ultimately delivering more efficient urban development and improved citizen experiences across Finnish municipalities.
Interactive maps of Finland enhance tourism experiences by providing real-time information, personalized recommendations, multilingual navigation, and location-based services for attractions, accommodations, and activities. These digital solutions streamline trip planning and discovery for visitors while enabling locals to explore hidden gems, with many tourism boards finding that interactive mapping delivers increased engagement, longer stays, and ultimately greater visitor satisfaction across Finland's diverse regions.
Administrative maps serve as fundamental tools for regional governance in Finland, enabling efficient resource allocation, policy implementation, and jurisdictional clarity across municipalities and provinces. These detailed territorial frameworks help government officials streamline administrative processes, coordinate public services, and manage regional development projects, while facilitating transparent communication between different governmental levels, ultimately delivering enhanced operational efficiency and more effective governance throughout Finland's decentralized administrative system.
Climate maps of Finland illustrate ecosystem changes through shifting temperature zones, altered precipitation patterns, forest composition transitions, and species migration corridors northward. These visualizations enable researchers, environmental agencies, and policymakers to track boreal forest transformations, wetland modifications, and Arctic tundra shifts, while many conservation organizations find that detailed mapping enhances strategic planning for biodiversity protection and habitat management.
Marine navigation maps are crucial for Finland's 1,250-mile coastline and 188,000 islands, providing essential depth measurements, hazard identification, harbor details, and shipping lane guidance. These specialized charts enable commercial shipping companies, ferry operators, and recreational boaters to navigate Finland's complex archipelago waters safely and efficiently, ultimately supporting the country's maritime economy and coastal tourism industry.
Finland's transportation maps accommodate vast rural areas through simplified road hierarchies, strategic junction emphasis, distance indicators, and seasonal route variations for remote regions. These design approaches streamline navigation by highlighting major corridors connecting sparse settlements, incorporating ferry routes and seasonal accessibility, ultimately delivering clearer wayfinding for both residents and visitors navigating Finland's expansive countryside.
Cartographers use bathymetric surveying, satellite imagery analysis, coastal profiling, selective generalization, and multi-scale representation to map Finland's complex archipelago. These techniques enable accurate depth measurements, shoreline delineation, and strategic island grouping, while maintaining navigational precision across different map scales, ultimately delivering enhanced maritime safety and resource management for shipping, tourism, and coastal planning industries.
Infographics can incorporate Finland maps by using choropleth coloring to show regional variations, overlay symbols for city-specific metrics, integrate timeline animations for temporal trends, and combine multiple data layers with interactive elements. These visual techniques enable clear representation of demographic shifts, economic indicators, and regional performance across Finnish municipalities, while maintaining geographic context that enhances audience comprehension and decision-making capabilities.
Creating accurate maps of Finland's remote areas faces challenges including harsh Arctic conditions, dense forest coverage, seasonal accessibility limitations, sparse infrastructure, and limited ground-based surveying opportunities. These obstacles are increasingly overcome through satellite imagery, drone technology, and GPS integration, with many geological survey organizations finding that combining multiple data sources delivers enhanced precision and comprehensive coverage of Finland's challenging northern territories.
GIS technology in Finland enhances environmental monitoring by enabling real-time data collection, satellite imagery analysis, predictive modeling, and comprehensive ecosystem mapping. Through advanced spatial analytics, Finnish environmental agencies can track forest health changes, monitor water quality across thousands of lakes, and predict climate impacts, ultimately delivering faster response times and more precise conservation strategies.
Finland's cartographic evolution reflects pivotal events including Swedish colonization (1150-1809), Russian imperial rule (1809-1917), independence in 1917, and Winter War territorial losses in 1940. These historical shifts fundamentally reshaped national boundaries, administrative divisions, and geographic identity, with modern Finnish mapping institutions ultimately delivering comprehensive territorial documentation that supports governance, resource management, and national sovereignty in an increasingly interconnected Nordic landscape.
-
Excellent products for quick understanding.
-
Excellent products for quick understanding.