


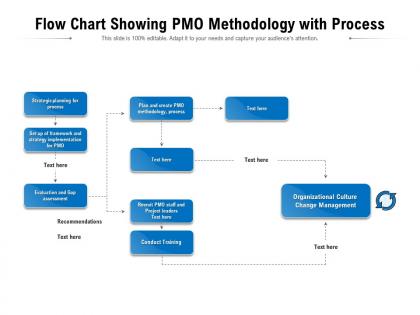
Flow chart showing pmo methodology with process




Try Before you Buy Download Free Sample Product
 Impress Your
 Audience
 100%
100% Editable
 Save Hours
 of Time


Our Flow Chart Showing PMO Methodology With Process are topically designed to provide an attractive backdrop to any subject. Use them to look like a presentation pro.
People who downloaded this PowerPoint presentation also viewed the following :
Flow chart showing pmo methodology with process with all 2 slides:
Use our Flow Chart Showing PMO Methodology With Process to effectively help you save your valuable time. They are readymade to fit into any presentation structure.
FAQs for Flow chart showing pmo
PMO methodology flow charts typically include project initiation, planning, execution, monitoring and control, and closure stages, along with governance checkpoints, resource allocation, and risk assessment phases. These structured workflows streamline project delivery by establishing clear decision points, standardizing processes across teams, and ensuring consistent quality control, ultimately enabling organizations to achieve better project outcomes and strategic alignment.
A well-designed PMO methodology flow chart improves project governance by establishing clear decision points, standardizing approval processes, and defining accountability structures across project lifecycles. Through visual workflow mapping, organizations streamline governance oversight, reduce bottlenecks, and ensure consistent risk management, with many enterprises finding that structured methodology charts ultimately deliver faster project approvals and enhanced strategic alignment.
Stakeholders provide strategic input, resource approval, project requirements, and success criteria throughout the PMO methodology flow chart, serving as decision gates and feedback providers at key milestones. Through structured communication protocols and governance touchpoints, stakeholders enable project alignment with business objectives, facilitate resource allocation, and ensure deliverables meet organizational expectations, ultimately driving successful project outcomes and strategic value realization.
PMO methodology flow charts vary significantly across industries based on regulatory requirements, project complexity, and organizational structure, with healthcare PMOs emphasizing compliance workflows while manufacturing focuses on lean processes. These variations enable organizations to streamline project governance, enhance resource allocation, and deliver industry-specific outcomes, ultimately providing competitive advantage through tailored methodologies that address sector-specific challenges and operational requirements.
Common challenges when implementing a PMO methodology flow chart include resistance to standardized processes, inadequate stakeholder buy-in, insufficient training on new workflows, and misalignment between organizational culture and prescribed methodologies. These implementation hurdles often surface in manufacturing and financial services organizations, where legacy processes create friction, though successful adoption ultimately delivers improved project visibility, enhanced resource allocation, and streamlined decision-making across departments.
A flow chart helps visualize PMO decision-making by mapping out approval workflows, resource allocation pathways, risk escalation procedures, and project governance checkpoints in a clear, sequential format. This visual approach enables project managers and stakeholders to understand complex decision trees more quickly, reduces approval bottlenecks, and ensures consistent processes across projects, ultimately delivering faster project execution and improved organizational alignment.
**INPUT**: What tools and software are recommended for creating PMO methodology flow charts? **OUTPUT**: Recommended tools include Microsoft Visio, Lucidchart, Draw.io, SmartDraw, and Miro, each offering templates, collaboration features, and integration capabilities. These platforms streamline PMO documentation by enabling real-time collaboration, automated updates, and seamless integration with project management systems, with many organizations finding that cloud-based solutions enhance accessibility and maintain consistency across teams. **Word count: 56 words**
The PMO methodology flow chart aligns with project management best practices by incorporating standardized governance frameworks, risk assessment protocols, stakeholder communication structures, and performance measurement systems throughout each phase. Through systematic integration of PMI standards and agile principles, organizations streamline project delivery, enhance resource allocation, and maintain consistent quality controls, ultimately delivering improved success rates and strategic alignment across their project portfolios.
Visual representations of PMO processes enhance team communication by improving clarity, reducing misunderstandings, accelerating onboarding, standardizing workflows, and enabling faster decision-making across project lifecycles. These visual tools streamline collaboration by providing common reference points, with many organizations finding that flowcharts and process maps ultimately deliver improved project delivery timelines and enhanced stakeholder alignment.
A PMO methodology flow chart should be reviewed quarterly and updated annually, or immediately following major organizational changes, project failures, or process improvements. This regular assessment ensures the methodology remains aligned with evolving business objectives, industry standards, and lessons learned, with many organizations finding that proactive updates significantly enhance project success rates and operational efficiency.
Successful PMO indicators include improved project delivery rates, enhanced resource utilization, standardized processes, better stakeholder communication, and increased strategic alignment with business objectives. These metrics flow through interconnected stages showing reduced project failures, optimized budget management, and accelerated time-to-market, with many organizations finding that mature PMOs deliver measurable competitive advantage and operational efficiency.
A PMO methodology flow chart assists in risk management by establishing standardized risk identification processes, defining clear escalation pathways, and integrating risk assessments at each project phase. Through systematic workflow visualization, organizations streamline risk monitoring, enhance cross-functional communication, and ensure consistent mitigation strategies, with many enterprises finding that structured risk frameworks significantly reduce project failures and delivery delays.
PMO methodologies that work well in flow charts include Agile, Waterfall, PRINCE2, Scrum, Lean Six Sigma, and Stage-Gate processes. These methodologies enhance project governance by providing clear decision points, standardized workflows, and measurable milestones, with many organizations finding that visual representations streamline stakeholder communication and ultimately deliver improved project success rates.
Organizations can customize their PMO methodology flow chart by adapting governance structures, modifying approval workflows, integrating industry-specific compliance requirements, and aligning decision points with existing operational processes. This strategic customization enables companies to streamline project delivery while maintaining organizational consistency, with many finding that tailored methodologies reduce implementation friction and enhance overall project success rates.
**INPUT**: What metrics can be tracked using a PMO methodology flow chart to evaluate project success? **OUTPUT**: PMO methodology flow charts enable tracking of schedule adherence, budget variance, resource utilization, quality deliverables, and stakeholder satisfaction metrics. These comprehensive measurement frameworks streamline project evaluation by providing real-time visibility into performance indicators, milestone completion rates, and risk mitigation effectiveness, with many organizations finding that structured metric tracking ultimately delivers improved project outcomes and enhanced strategic alignment.
-
Commendable slides with attractive designs. Extremely pleased with the fact that they are easy to modify. Great work!
-
Easily Understandable slides.
-
Amazing product with appealing content and design.
-
Unique research projects to present in meeting.
-
Use of different colors is good. It's simple and attractive.