

Flowchart Of Insurance Company Claim Application Processing




Try Before you Buy Download Free Sample Product
 Impress Your
Audience
 100%
Editable
 Save Hours
of Time


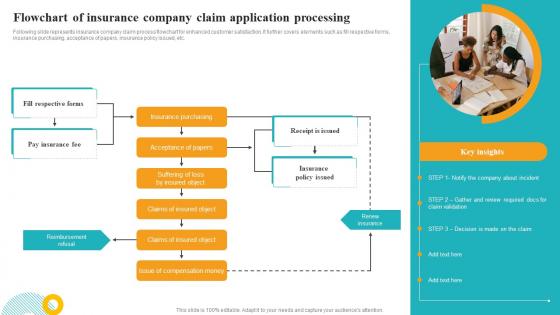
Following slide represents insurance company claim process flowchart for enhanced customer satisfaction. It further covers elements such as fill respective forms, insurance purchasing, acceptance of papers, insurance policy issued, etc.
People who downloaded this PowerPoint presentation also viewed the following :
Flowchart Of Insurance Company Claim Application Processing with all 9 slides:
Use our Flowchart Of Insurance Company Claim Application Processing to effectively help you save your valuable time. They are readymade to fit into any presentation structure.








FAQs for Flowchart Of Insurance Company
Key stages in the insurance claim processing flowchart include claim submission, initial review and documentation, investigation and verification, damage assessment, coverage analysis, and settlement determination. These stages streamline operations by automating documentation, accelerating verification processes, and enhancing decision accuracy, with many insurance companies finding that structured workflows reduce processing times and improve customer satisfaction.
A well-structured flowchart improves claim processing efficiency by standardizing workflows, eliminating redundant steps, and providing clear decision points for faster adjudication. These visual frameworks enable insurance companies to reduce processing times, minimize errors, and enhance customer satisfaction, with many organizations finding that streamlined processes ultimately deliver faster settlements and improved operational transparency.
Data collection serves as the foundational step in insurance claim processing, encompassing policyholder information, incident details, documentation evidence, witness statements, and supporting medical or repair records. This comprehensive data gathering enables insurers to streamline claim validation, accelerate assessment timelines, and enhance decision accuracy, with many insurance companies finding that robust initial data collection significantly reduces processing delays and improves customer satisfaction outcomes.
Visualization tools enhance claim processing understanding by transforming complex workflows into clear, intuitive diagrams that highlight decision points, bottlenecks, and approval pathways. Through interactive flowcharts and process maps, insurance teams can quickly identify inefficiencies, streamline handoffs between departments, and reduce claim resolution times, ultimately delivering faster customer service and improved operational transparency.
Common bottlenecks in insurance claim processing include document verification delays, manual data entry errors, approval workflow backlogs, compliance review stages, and communication gaps between departments. A well-designed flowchart helps organizations identify these friction points by mapping each process step, enabling insurers to streamline workflows, automate repetitive tasks, and ultimately deliver faster claim resolutions while reducing operational costs.
Technology streamlines claim processing through automated data extraction, AI-powered fraud detection, digital document management, real-time status tracking, and automated decision-making for routine claims. These innovations significantly reduce processing times from weeks to days, minimize manual errors, and enhance customer satisfaction, with many insurance companies finding that automation delivers faster claim resolutions and lower operational costs.
Improper claim processing flow leads to delayed settlements, increased operational costs, regulatory compliance issues, customer dissatisfaction, and potential fraud exposure. These inefficiencies ultimately result in higher claim abandonment rates, damaged brand reputation, and competitive disadvantage, with many insurance companies finding that streamlined processing systems significantly reduce costs while enhancing customer retention and regulatory compliance.
Different insurance types require specialized flowchart pathways due to varying verification processes, regulatory requirements, and documentation needs. Health insurance involves medical code validation and provider networks, auto insurance requires accident reconstruction and liability assessment, while property insurance demands damage appraisals and coverage verification, with many insurers finding that customized workflows for each type streamline processing times and improve customer satisfaction.
Staff training for claim processing flowcharts should include flowchart interpretation, system navigation, regulatory compliance procedures, documentation standards, and exception handling protocols. Through comprehensive onboarding programs, insurance companies enable faster claim reviews, reduced processing errors, and improved customer service delivery, with many organizations finding that structured training ultimately enhances operational efficiency and staff confidence.
Feedback from claimants can be integrated through systematic touchpoint analysis, post-claim surveys, complaint pattern mapping, and real-time feedback loops at each flowchart stage. Insurance companies increasingly use this data to streamline documentation requirements, reduce approval timeframes, and enhance digital interfaces, with many finding that claimant-driven improvements significantly boost satisfaction scores and operational efficiency.
Metrics for evaluating insurance claim processing flowchart effectiveness include claim cycle time, first-call resolution rates, processing accuracy, customer satisfaction scores, and cost per claim. These measurements enable insurers to identify bottlenecks, streamline workflows, and enhance operational efficiency, with many companies finding that optimized flowcharts reduce processing times by 30-40% while improving customer experiences.
Regulatory requirements significantly influence claim processing by mandating specific documentation standards, compliance checkpoints, and audit trails throughout each workflow stage. These regulations ensure proper verification protocols, fraud detection measures, and timely settlement procedures, with insurance companies finding that systematic compliance integration ultimately streamlines operations while maintaining regulatory adherence and customer trust.
Insurance claim processing flowchart design should prioritize clear decision points, standardized symbols, logical sequence flow, comprehensive stakeholder identification, and detailed documentation requirements at each stage. Effective flowcharts streamline operations by reducing processing delays, minimizing errors, and enhancing transparency, with many insurance companies finding that well-designed visual workflows ultimately deliver faster claim resolutions and improved customer satisfaction.
A flowchart enhances interdepartmental communication by providing a standardized visual reference that clarifies role responsibilities, handoff points, and decision-making authority across claims processing stages. This shared framework enables underwriting, claims adjustment, customer service, and legal departments to coordinate seamlessly, reducing miscommunication and processing delays while ensuring consistent service delivery and faster claim resolutions.
**INPUT**: What tools or software are recommended for creating insurance claim processing flowchart? **OUTPUT**: Recommended tools include Microsoft Visio, Lucidchart, Draw.io, Creately, and specialized process mapping software like Bizagi or ProcessMaker. These platforms streamline workflow visualization by offering insurance-specific templates, collaborative editing capabilities, and integration features, with many insurance companies finding that digital flowchart tools enhance compliance documentation, accelerate staff training, and improve operational transparency across claims departments. **Word count: 60**
-
Commendable slides with attractive designs. Extremely pleased with the fact that they are easy to modify. Great work!
-
The templates are the best in class. Very clear and innovative graphics! I am excited to explore and download more presentations.