


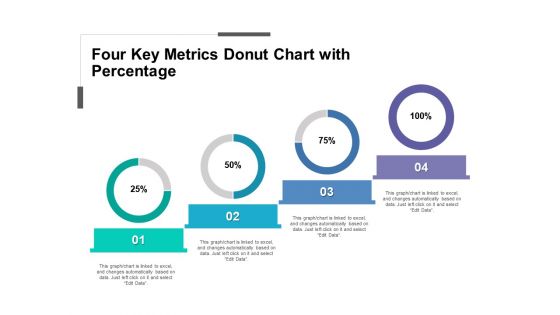
Gráfico de anillos de cuatro métricas clave con porcentaje




Try Before you Buy Download Free Sample Product
 Impress Your
Audience
 100%
Editable
 Save Hours
of Time


Obtenga el gráfico de anillos de cuatro métricas clave con porcentaje PPT creado profesionalmente para medir el crecimiento de tiempo a tiempo de su empresa y crear presentaciones de diapositivas únicas para mostrar a sus gerentes inmediatos, clientes, inversores o cualquier otro público objetivo. El diseño PPT es un marcador muy útil en la actualidad, ya que el conocimiento del progreso de su empresa le ayuda a hacer planes de negocios en consecuencia. Además, este diseño PPT registra todos los factores que influyen en el crecimiento de su organización de una manera estructurada, innovadora y profesional. La diapositiva de diseño actúa como un intermediario para llenar las lagunas en su proyecto actual y el sistema que se pasan por alto o se ignoran. El uso de este innovador diagrama PPT ayudará a la audiencia a comprender mejor los detalles de un proyecto y sugerir nuevas ideas para hacer planes de negocios. Por lo tanto, simplemente descargue y personalice nuestra plantilla PPT de gráfico de anillos de cuatro métricas clave con porcentaje con información relacionada con su negocio y muéstresela a los miembros de su equipo. Empiece a trabajar con nuestro gráfico de anillos de cuatro métricas clave con porcentaje. Salte de los bloques con sus pensamientos.
People who downloaded this PowerPoint presentation also viewed the following :
Cuadro de anillos de cuatro métricas clave con porcentaje con las 5 diapositivas:
Guíe a la gente a contrarrestar las circunstancias cambiantes con nuestro Cuadro de anillos de cuatro métricas clave con porcentaje. Adviértelos sobre la inestabilidad.


FAQs for Four key metrics donut
So donut charts? They're just pie charts with the middle cut out. Same data, but you can throw totals or whatever in that empty center space - super useful for dashboards. Honestly, they look way cleaner than regular pie charts, especially when you've got a bunch of data points cluttering things up. Both show parts of a whole fine, but donuts are just easier to look at. Oh and if you're doing anything for executives or higher-ups, definitely skip the pie charts. They'll think donuts look more polished.
Donut charts work really well for "parts of a whole" stuff - like budget breakdowns or user segments. They instantly show that everything adds up to 100%, which bar charts don't do as obviously. Plus you can squeeze multiple donuts into a dashboard without hogging space. The center hole is perfect for your total number too, which I actually love. Bar charts are still better if you're just comparing individual values though. Don't try to force a donut chart when a simple bar would work better - I've seen people do this and it gets weird. But for any "slice of the pie" scenario, donuts are solid.
High contrast is your best friend here - blues against oranges work way better than similar shades that just muddy together. I always do this weird thing where I squint at my charts or check them in grayscale to see if they still work. Skip red-green combos since colorblind folks can't distinguish them. Brand colors are nice but honestly accessibility wins every time. Sequential data? Stick with one color family and just vary the intensity. Don't go crazy with segments - 5-7 max or it gets messy. Labels are clutch so people aren't guessing what each slice means.
Honestly, donut charts are solid for budget breakdowns or survey stuff where you've got like 3-5 categories max. The center space is perfect for dropping in your total or main number. But here's the thing - they get messy fast with tiny slices under 5% or when you're dealing with more than 6 categories. Total nightmare to read. Also, if people need to compare exact values between sections? Just go with bar charts instead. Way cleaner. Oh, and obviously if your data doesn't add up to 100%, you'll want something completely different anyway.
Honestly, just go with Excel if you want something quick that looks good. Tableau's amazing for big datasets and interactive stuff, but it's probably overkill depending on what you need. PowerBI's solid too. Oh, and don't sleep on Canva - I was skeptical but their donut chart templates actually look pretty professional. Google Sheets works but the formatting options kinda suck. If you're presenting to higher-ups, definitely stick with Excel or Tableau since you'll have way more control over colors and labels. Can't go wrong starting with Excel though!
Okay so donut charts - keep them simple with like 3-5 categories tops. Use colors that pop and work for colorblind people too. Skip the legend completely and just label stuff right on the chart (legends are honestly annoying). Your percentages should add up to 100% obviously, and throw in the actual numbers too since some people get numbers better that way. Give it a clear title so people know what they're looking at. Oh and test it on someone who didn't help make it - if they're confused, you need to simplify more.
Dude, you HAVE to label your donut charts properly or people will just stare at colorful circles like confused pandas. Put labels right on the segments when you can - saves people from constantly looking back and forth at a legend. Though honestly, legends are still super helpful, especially when you've got like 5+ categories crammed in there. Position your legend somewhere logical (not competing with the actual data), and definitely throw in percentages if possible. Nobody wants to guess what that tiny orange sliver represents. It's the difference between a useful chart and modern art.
Donut charts work best when you drop them at those big "aha" moments in your story - like when you're showing a massive before/after shift or one segment just completely dominates everything else. I'm probably weird but I actually love using them to make people pause and really absorb a key percentage. Don't just throw one up there though. Walk through each slice deliberately, then tie it back to your main point. Annotations help too - they guide people's eyes to the slice that matters most. Context is everything with these things.
So the main thing is making sure your segments actually match your data - don't go making tiny slivers nobody can read. I'd cap it at like 5-7 segments tops because more than that gets messy fast. Order them by size usually, unless there's some other logic that makes sense. Your colors need enough contrast so people can tell them apart - sounds obvious but you'd be surprised how often I see charts where everything blends together. Keep the center clean, maybe throw one key number in there if it helps. Oh and don't let one huge slice take over the whole thing unless that's actually the story you're telling.
Honestly, group anything under 5% into an "Other" category - trust me on this one. I once made a donut chart that looked like someone threw Skittles at a wall. Stick to your top 5-7 categories max and dump the rest together. If you've got too many slices, try a legend instead of cramming labels everywhere. Or just switch to a bar chart if you really need to show everything (sometimes donut charts aren't the answer, even though they look cooler). What story are you actually trying to tell here?
Donut charts are solid for percentage breakdowns - market share, budget splits, customer segments, that kind of thing. The clean look works well in presentations, and honestly, executives seem to dig them more than regular pie charts. Just don't go crazy with categories - more than 5 or 6 gets cluttered real quick. Here's the trick: use that center space for your total or main number since it's just sitting there empty anyway. Perfect for quarterly reviews when you want to spotlight a specific segment. Way better than pie charts if you ask me.
Honestly, donut charts work way better than regular pie charts for keeping people engaged. The empty center gives your eyes a break from all the visual clutter - makes everything easier to process. You can drop your key number right in that center space too, which is pretty smart. They look way more polished and modern than basic pie charts (probably why I see them everywhere now). Your audience won't get overwhelmed trying to read the data. The white space actually helps people retain the info better since their brain isn't working overtime to decode everything.
Hey! Few things to watch for - keep it to 5-6 slices max or it gets crazy messy. Always start your first slice at 12 o'clock, makes everything look cleaner. Don't use similar colors next to each other, they just blend together and confuse people. Also your percentages better add up to 100% lol. Honestly, 3D donut charts are the worst - they make everything look warped. Oh and that center space? Perfect spot for your total or main number instead of just leaving it blank. Makes the whole thing way more useful.
Hover effects are a game changer - they'll show detailed breakdowns without making your chart look messy. Make segments clickable so users can drill into subcategories. Tooltips are honestly the MVP here, displaying exact values and percentages on demand. I've built some where you can toggle legend items on/off by clicking them, which is perfect for comparing specific data. Smooth animations when loading or switching datasets make everything feel more polished too. Start with hover tooltips and clickable legends - those two alone will transform your donut charts from boring static images into something people actually want to interact with.
Honestly, just label each slice directly on the chart instead of making people look back and forth at a legend - saves everyone time. Put the total number right in that center hole, and throw in percentages too if you can. Colors should make sense (red = bad, green = good, you know the drill). Oh, and if you've got those tiny slices that are barely visible? Just lump them into "Other" because otherwise it looks messy. Pick a title that actually tells people what they're supposed to learn from it. Trust me, most people will glance at it for like 3 seconds max.
-
Thanks for all your great templates they have saved me lots of time and accelerate my presentations. Great product, keep them up!
-
Great product with effective design. Helped a lot in our corporate presentations. Easy to edit and stunning visuals.