

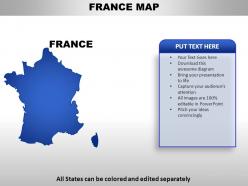
France country powerpoint maps





Try Before you Buy Download Free Sample Product
 Impress Your
Audience
 100%
Editable
 Save Hours
of Time


Talented designers have helped curate this library of France Country PowerPoint Maps. Make their talent work for you in your next presentation presentation.
People who downloaded this PowerPoint presentation also viewed the following :
France country powerpoint maps with all 7 slides:
Thousands of carefully developed France Country PowerPoint Maps are available. Take advantage of the chance to make your next project perfect.


FAQs for France
France's historical borders reflect centuries of territorial evolution through wars, treaties, and political transformations, with maps showcasing expansions during Napoleon's empire, losses like Alsace-Lorraine to Germany, and colonial acquisitions across Africa and Asia. These cartographic changes illustrate how France strategically consolidated its hexagonal mainland boundaries while building a global empire, with many historians finding that border modifications directly correlate with France's shifting geopolitical influence and national identity formation.
Modern cartography techniques have dramatically enhanced France map accuracy through satellite imagery, GPS positioning, LiDAR scanning, and digital terrain modeling. These technologies enable precise geographic measurements, real-time updates, and detailed topographical representations, with French mapping agencies like IGN delivering centimeter-level accuracy for urban planning, infrastructure development, and environmental monitoring, ultimately providing citizens and businesses with reliable spatial data for strategic decision-making.
Thematic maps showcase France's cultural and geographical diversity by visualizing regional languages, culinary traditions, architectural styles, climate zones, and topographical features across different territories. These specialized maps enable researchers, educators, and policymakers to understand spatial patterns of French heritage, from Breton culture in Brittany to Mediterranean influences in Provence, ultimately delivering comprehensive insights for cultural preservation and regional development strategies.
Historical maps of France enhance regional identity understanding by revealing evolving territorial boundaries, cultural zones, linguistic distributions, administrative divisions, and economic networks across centuries. Through cartographic analysis, researchers trace how regions like Brittany, Alsace, and Provence maintained distinct characteristics while integrating into the French state, ultimately delivering deeper insights into contemporary regional politics and cultural preservation efforts.
Tourist maps of France emphasize attractions, accommodations, restaurants, and transportation routes, while topographic maps focus on elevation contours, terrain features, and precise geographical measurements. Tourist maps streamline information for recreational travelers through simplified navigation and highlighted points of interest, whereas topographic maps deliver detailed spatial data for hikers, researchers, and professionals requiring accurate terrain analysis, ultimately serving distinct user needs and applications.
Every detailed map of France should include major cities like Paris and Lyon, regional boundaries, transportation networks, topographical features like the Alps and Loire Valley, and coastal areas along the Mediterranean and Atlantic. These comprehensive elements enable travelers, businesses, and educational institutions to navigate effectively, plan logistics, and understand geographical context, with many organizations finding that detailed cartographic information enhances operational efficiency and strategic decision-making.
Digital mapping tools revolutionize accessibility to French geographical information by providing real-time data, interactive visualizations, multilingual interfaces, and mobile compatibility. These platforms enable researchers, tourists, urban planners, and businesses to access detailed topographical, demographic, and infrastructure data instantly, while GPS integration and satellite imagery deliver enhanced navigation and location-based services, ultimately democratizing geographical knowledge across diverse user groups.
Political changes across Europe significantly influence French cartography through updated border delineations, administrative restructuring, and regional policy modifications. These shifts affect how France maps its territorial boundaries, EU jurisdictional areas, and cross-border economic zones, with cartographers increasingly incorporating geopolitical data to reflect France's evolving position within European frameworks, ultimately delivering more accurate territorial representations and strategic planning tools.
France maps enable educators to teach geography and history through interactive lessons combining topographical features, historical boundaries, regional cultures, and economic zones. These visual tools enhance student engagement by connecting abstract concepts to concrete locations, with many teachers finding that layered maps showing evolution of French territories, major historical events, and cultural regions create memorable learning experiences while developing spatial reasoning skills.
Creating bilingual maps for France's linguistically diverse regions presents challenges including space constraints for multiple language labels, standardizing regional dialect spellings, maintaining cartographic clarity while accommodating varying text lengths, and ensuring cultural accuracy in place name translations. These mapping complexities require strategic design approaches, collaborative linguistic research, and careful typography selection, with many cartographic organizations finding that digital platforms increasingly enable layered language options while preserving map readability and cultural authenticity.
France's geographical features fundamentally influence cartographic design through elevation shading for the Alps and Pyrenees, detailed river networks highlighting the Seine and Loire systems, and coastal boundary definitions along the Mediterranean and Atlantic. These natural landmarks serve as essential reference points for navigation, regional planning, and infrastructure development, with many cartographers finding that topographical accuracy enhances both commercial applications and educational resources.
Local artists transform traditional cartography by incorporating regional cultural elements, historical landmarks, artistic traditions, local folklore, and distinctive architectural styles into their French regional maps. Through watercolor techniques, hand-drawn illustrations, and personalized storytelling approaches, these creators enable tourism boards, cultural institutions, and local businesses to offer authentic experiences that resonate with visitors, ultimately delivering enhanced cultural connection and competitive differentiation in France's increasingly crowded tourism landscape.
Maps of France contribute to understanding environmental changes and urban development by visualizing land use patterns, tracking deforestation and urbanization trends, and documenting infrastructure expansion over time. Through geographic information systems and satellite mapping, urban planners and environmental agencies can monitor coastal erosion, agricultural shifts, and metropolitan growth, while policy makers leverage these insights for sustainable development planning, ultimately delivering data-driven decisions that balance economic growth with environmental preservation.
Best practices for designing engaging France map presentation templates include using high-contrast color schemes, incorporating regional boundaries clearly, ensuring text readability over map elements, selecting appropriate zoom levels for your content focus, and maintaining consistent visual hierarchy throughout slides. These design principles enhance audience comprehension by balancing aesthetic appeal with functional clarity, while strategically positioning data overlays and annotations ensures maximum impact for business presentations across tourism, logistics, and market analysis sectors.
User-generated maps and open-source platforms enhance understanding of French regional nuances by crowdsourcing local insights, capturing cultural variations, documenting historical context, and highlighting geographic distinctions that traditional mapping overlooks. These collaborative approaches enable researchers, businesses, and institutions to access granular data about local customs, dialects, and economic patterns, ultimately delivering more targeted regional strategies and deeper cultural intelligence for organizations operating across France's diverse territories.
-
Qualitative and comprehensive slides.
-
Qualitative and comprehensive slides.