

Funnel diagram with business icons filter process flat powerpoint design





Try Before you Buy Download Free Sample Product
 Impress Your
Audience
 100%
Editable
 Save Hours
of Time


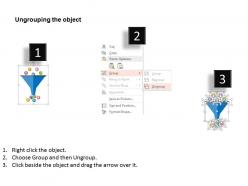
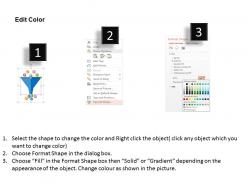
A well-defined, carefully measured sales funnel is one of the most powerful tools that an organization has at its disposal. So check out our funnel diagram with business icons filter process flat PPT Template. Graphic of funnel diagram with business icons has been used to design this PPT Slide. This slide contains the concept of business filter process. Use this PPT Graphic for business and marketing related presentations. A sales funnel is a visual metaphor for the path taken by a potential customer as he or she moves towards becoming a customer. Frequently used by sales and marketing organizations, the sales funnel helps companies understand and visualize their sales process and measure overall conversion success between each step of the funnel. Our slide has a funnel with icons both at the top and at the bottom of the funnel. The goal of marketing sales in this model is to get as many prospects in at the top of the funnel and convert them into customers. Just start initializing this PPT Template Design for improving your business sales. Our Funnel Diagram With Business Icons Filter Process Flat Powerpoint Design are as handy as they come. You will find them delightfully convenient.
People who downloaded this PowerPoint presentation also viewed the following :
Funnel diagram with business icons filter process flat powerpoint design with all 4 slides:
Business will evolve with our Funnel Diagram With Business Icons Filter Process Flat Powerpoint Design. You will grow to become a great entrepreneur.


FAQs for Funnel diagram with business icons filter process
Honestly, funnel charts are perfect for showing how things get filtered down through different stages. Sales teams love them - you can track leads all the way to actual customers. Works great for hiring too, seeing candidates drop off at each interview round. The visual just makes sense, right? People immediately understand that wide-to-narrow flow. Just make sure the widths actually match your real numbers - I've seen too many where they just made it "look pretty" instead of being accurate. Way better than those dull bullet point lists everyone defaults to. Next time you've got any process with natural drop-offs, definitely try a funnel chart instead.
A funnel diagram basically maps your sales stages - starts wide with all your leads, then narrows as people move through qualification, demos, proposals, until you get conversions at the bottom. Super useful for spotting where you're bleeding prospects. Each stage shows your conversion rates so you can find those annoying bottlenecks. Plus it helps track sales velocity, which is clutch. I always throw actual numbers on mine and color-code the stages - makes team meetings way more productive. Honestly beats staring at spreadsheets all day.
Okay so four things to nail down: clear labels, accurate proportions, logical flow, and consistent styling. First map out your actual user journey - like where people really drop off, not where you think they do. Each section width should match your real conversion rates because fake-looking funnels are honestly just embarrassing. Your stage labels need to be specific enough that anyone gets it immediately. Keep colors and fonts the same throughout (sounds obvious but you'd be surprised). Oh and make sure the flow direction actually makes sense - I've seen some wild funnel designs that confuse more than they help. Build the visual around real touchpoints, not wishful thinking.
Funnel diagrams work for tons of stuff beyond sales! Marketing teams use them to track how website visitors convert. HR departments map candidates from application to hiring. You can also apply them to user onboarding or educational programs - honestly, even customer support ticket flows. The main thing is starting with a big group that gets smaller at each stage. First, figure out your stages. Then see where people bail out. That's where you focus your fixes. I mean, it's pretty straightforward once you think about it that way.
Dude, color-coding makes such a huge difference for funnel diagrams. I usually do blue for organic traffic, green for paid ads - whatever makes sense for your data. Sharp edges work great where people are dropping off, but use rounded corners for smooth parts. Oh and that gradient thing from dark to light? Total game-changer since it matches how funnels actually narrow down. You'll want to stay consistent though so people don't get confused. Honestly can't stand those boring gray funnels everyone defaults to - they're impossible to read quickly.
Honestly, just start with whatever your team's already using - probably PowerPoint or Google Slides. They're perfect for basic funnels and everyone knows them. If you need something fancier, check out draw.io (it's free and way better than it should be). Lucidchart's another good option but costs money. Now if you're dealing with actual data that changes, you'll want Tableau or Power BI. Fair warning though - they're kind of a pain to learn at first. Oh, and Canva works too if you want something that looks nice without being a design wizard. Really depends on how complex you're getting.
So picture your funnel like an actual funnel - wide at the top, narrow at the bottom. Your biggest group starts at the top (website visitors, people who saw your ad, whatever). Then you lose people at every step down. Some sign up, fewer browse products, even fewer add stuff to cart, and way fewer actually buy. The numbers can be kinda shocking tbh! When you see where the biggest drops happen, that's where you need to focus. Like if tons of people add to cart but barely anyone checks out, your payment process is probably janky. Makes total sense once you visualize it.
Honestly, the worst thing you can do is make your funnel stages way too vague. Like, you need actual measurable steps that show how people really move through your process - not just random broad categories. Don't get caught up in those nice declining numbers either. The magic happens when you figure out WHY people bail at each stage. That's the good stuff. Oh, and funnels only work for sequential processes btw. If people can jump around randomly, you're gonna have a bad time. Always include conversion rates between stages (people forget this constantly). Map your real customer journey first, then build around those actual touchpoints. Way easier that way.
Honestly, it's all about matching the detail level to whoever's looking at it. Executives just want the big conversion numbers and clean visuals - don't overwhelm them. Your marketing team though? They'll want everything broken down by stage, traffic sources, maybe some color coding for different campaigns. Sales folks care more about lead quality and how long conversions take. Oh, and I always throw in little notes for context - sounds minor but it actually helps a ton! The trick is figuring out what questions they're trying to answer first, then build from there. Short sentences work great for some audiences too.
Dude, visualization is everything with funnel diagrams. Without it, you're basically just throwing numbers at people in a triangle shape - which is useless. Good visuals let you spot drop-offs immediately. I learned this the hard way when I made this terrible funnel that looked like a rainbow threw up on a spreadsheet. Keep your colors consistent and make sure the proportions actually mean something. Clean labels are clutch too. Honestly, if stakeholders can't look at it for 5 seconds and know exactly which stage is bleeding customers, you've failed. The whole point is making conversion rates obvious.
Stick to 5-7 stages max - any more and people's eyes just glaze over. Your labels should be simple stuff anyone can understand, not corporate speak that sounds pretentious. Make everything flow top to bottom with matching colors and fonts. I swear, some funnels look like someone threw up a bag of Skittles on them. Only include data that actually matters - resist the urge to show off every metric you've got. Oh, and definitely test it on a coworker first. If they're confused, you'll know it needs work.
Make your funnel labels super specific - "Visited Website," "Added to Cart," "Completed Purchase" instead of fuzzy stuff like "Interest." Anyone should get what each stage means right away. Keep the wording consistent across stages too. I've worked with funnels that were just chaos - random verb tenses everywhere. Looks amateur honestly. Stick to 2-4 words per label max. Nobody wants to read a novel. Oh, and test them with people who didn't build the thing with you. What makes perfect sense to you might be confusing to everyone else. Fresh eyes catch that stuff.
Focus on your main conversion points first - those can't be negotiable. Only throw in percentages where they actually help with decisions, not just because the data exists. Stage labels should be super short, like 2-4 words tops. I've seen so many funnels where people stuff every detail into the visual and it's just... why? Nobody can read that mess. If your stakeholders want the nitty-gritty details, make a separate table or something. Here's what I always do - show it to someone fresh. If they're squinting at it or seem confused, you've probably overdone it.
Dude, animated funnels are a game changer. Instead of showing everything at once, you reveal each stage as you talk through it. Keeps people way more engaged than boring static charts. Each section appears right when you need it, so your audience can actually follow the conversion rates without their eyes glazing over. The animation naturally highlights where people drop off too - makes those problem areas super obvious. I swear stakeholders pay way better attention when there's movement on screen. Just time each funnel piece to match what you're saying and you'll stay on track too.
Dude, funnel diagrams are game-changers for figuring out where you're bleeding customers. Map out your whole journey from first contact to sale, then track drop-off rates at each stage. You'll instantly see if people are bouncing during lead gen, getting stuck in nurturing, or bailing right before closing. Way better than just staring at revenue numbers wondering what went wrong. I actually wish I'd started using these sooner - would've saved me so much guesswork. Just pick your stages and start measuring the percentages between each one.
-
Great experience, I would definitely use your services further.
-
Very unique and reliable designs.