

Gantt Chart For Executive Onboarding With Performance Evaluation





Try Before you Buy Download Free Sample Product
 Impress Your
Audience
 100%
Editable
 Save Hours
of Time


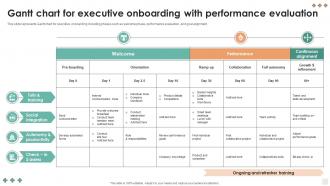
This slide represents Gantt chart for executive onboarding including phases such as welcome phase, performance evaluation, and goal alignment.
People who downloaded this PowerPoint presentation also viewed the following :
Gantt Chart For Executive Onboarding With Performance Evaluation with all 9 slides:
Use our Gantt Chart For Executive Onboarding With Performance Evaluation to effectively help you save your valuable time. They are readymade to fit into any presentation structure.






FAQs for Gantt Chart For Executive Onboarding
Key components include timeline milestones, stakeholder responsibilities, resource allocation, performance checkpoints, and integration activities across departments. These elements streamline executive transitions by establishing clear expectations, coordinating cross-functional support, and tracking progress systematically, with many organizations finding that structured onboarding accelerates leadership effectiveness and organizational integration.
A Gantt chart displays executive onboarding timelines through horizontal bars representing each phase duration, with clear start dates, end dates, and milestone markers for key activities like documentation completion, department introductions, and performance checkpoints. This visual approach enables HR teams and executives to track progress across overlapping tasks, identify potential delays in critical onboarding stages, and ensure seamless integration while maintaining accountability throughout the process.
Executive onboarding performance metrics should include goal achievement rates, stakeholder relationship development, strategic initiative progress, team integration effectiveness, and cultural alignment scores. These measurements enable organizations to track leadership transition success through quantifiable outcomes like project milestone completion, cross-departmental collaboration levels, and employee engagement improvements, ultimately ensuring new executives deliver competitive advantage and operational efficiency.
Gantt charts help identify onboarding bottlenecks by visualizing task dependencies, revealing critical path delays, and highlighting resource conflicts across different phases. Through timeline mapping, HR teams can spot overlapping activities, anticipate capacity constraints, and proactively address delays in areas like system access setup or training scheduling, ultimately streamlining the onboarding experience.
Technology integration into Gantt charts enhances executive onboarding through automated task tracking, real-time progress updates, collaborative dashboards, and intelligent milestone alerts. These digital tools streamline coordination between HR, IT, and department heads, while delivering personalized onboarding experiences and data-driven insights that accelerate executive productivity and organizational integration.
Stakeholder feedback helps refine Gantt charts by identifying timeline bottlenecks, clarifying role dependencies, adjusting milestone priorities, and highlighting resource allocation gaps throughout the onboarding process. Through regular input from HR teams, department heads, and new executives, organizations can streamline onboarding sequences, enhance cross-functional coordination, and ultimately deliver more personalized executive integration experiences.
Gantt charts can be adapted for executive onboarding across industries by customizing milestones, stakeholder interactions, and compliance requirements specific to each sector's regulatory and operational demands. Financial services may emphasize regulatory training and risk assessments, while healthcare focuses on patient safety protocols and accreditation requirements, with manufacturing prioritizing operational safety and supply chain integration, ultimately delivering faster executive integration and enhanced organizational performance.
Common Gantt chart onboarding challenges include resource conflicts, unrealistic timelines, interdependency complexity, limited flexibility for role-specific needs, and stakeholder alignment issues. These obstacles can be mitigated by implementing buffer time planning, regular milestone reviews, automated tracking systems, and collaborative feedback loops, with many organizations finding that integrated project management platforms streamline coordination while maintaining executive-level visibility throughout the process.
Executive onboarding program success can be measured through Gantt chart completion rates, milestone adherence timelines, resource utilization efficiency, and integration velocity tracking across departments. These metrics enable organizations to assess onboarding effectiveness by analyzing time-to-productivity ratios, stakeholder engagement levels, and goal achievement patterns, with many companies finding that structured timeline analysis delivers enhanced executive performance and faster strategic contribution.
Popular Gantt chart tools for executive onboarding include Microsoft Project, Asana, Smartsheet, Monday.com, and Wrike, each offering timeline visualization and task management capabilities. These platforms streamline onboarding workflows by enabling milestone tracking, resource allocation, and progress monitoring, with many organizations finding that integrated collaboration features enhance coordination between HR teams, department heads, and new executives throughout the evaluation process.
Gantt chart updates during executive onboarding should be managed through weekly progress reviews, stakeholder feedback sessions, milestone checkpoint assessments, and real-time task adjustments based on learning curves. These tracking mechanisms streamline the integration process by enabling proactive timeline modifications, resource reallocation, and performance optimization, with many organizations finding that structured update protocols ultimately deliver faster executive productivity and enhanced strategic alignment.
Gantt charts facilitate cross-departmental communication during onboarding by providing visual timeline clarity, shared milestone tracking, dependency mapping, and real-time progress updates that keep HR, IT, management, and training teams aligned. Through centralized project visibility, departments can coordinate resource allocation, identify potential bottlenecks, and ensure seamless handoffs between onboarding phases, ultimately delivering faster integration and enhanced new hire experiences.
Previous Gantt chart implementations in executive onboarding reveal that clear milestone definition, realistic timeline allocation, and stakeholder accountability significantly enhance success rates. Organizations across industries find that incorporating buffer periods for relationship building, regular progress checkpoints, and flexible task dependencies ultimately delivers smoother transitions and faster executive productivity.
Longer onboarding timelines enable more detailed Gantt chart planning with granular task breakdowns, clearer milestone mapping, and comprehensive dependency tracking, while shorter timelines require streamlined approaches focusing on critical activities. Extended timelines allow organizations to incorporate buffer periods, stakeholder feedback loops, and iterative adjustments, ultimately delivering more thorough executive integration and measurable performance outcomes across departments.
Gantt charts effectively support ongoing performance evaluations by tracking quarterly reviews, annual assessments, development milestones, goal completion timelines, and continuous feedback cycles. These visual tools enable managers to monitor employee progress, identify performance gaps, and coordinate evaluation schedules across departments, with many organizations finding that structured timeline visualization enhances accountability and streamlines performance management processes.
-
SlideTeam never fails to surprise me with its amazing PPT designs. Thanks team for providing me with your constant support!
-
Excellent design and quick turnaround.