

Getting started with customer behavioral analytics powerpoint presentation slides




Try Before you Buy Download Free Sample Product
 Impress Your
 Audience
 100%
100% Editable
 Save Hours
 of Time


In today’s world, data is king. The more data you have, and the better you can understand it, the more successful your business will be. That’s why we are so excited to share our newest set of powerpoint templates with you: customer behavioral analytics. These templates will help you get insights into how your customers behave on your website, what they are interested in, and where they drop off in the purchase process. This information is essential for understanding how to improve your website design and marketing strategy to increase sales. So what are you waiting for? Download these amazing set of data analytics powerpoint templates now.
People who downloaded this PowerPoint presentation also viewed the following :
Content of this Powerpoint Presentation
Slide 1: This is the cover slide of Getting Started with Customer Behavioral Analytics PowerPoint Presentation.
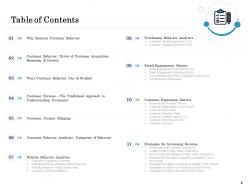
Slide 2: This is Table of Contents slide that lists out all the essential elements covered in the deck.
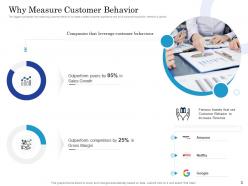
Slide 3: This slide presents the reason to measure customer behaviour.
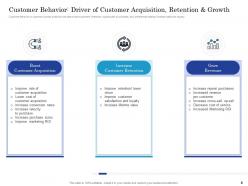
Slide 4: This slide presents customer behaviour: Driver of customer acquisition, retention and growth.
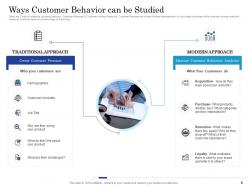
Slide 5: This slide presents that there are 2 ways to measure customer behavior- Customer Personas & Customer Journey Analytics. Customer Personas are a semi-fictional representation of your target customers while customer journey analytics measures customer behavior at each stage of the journey.
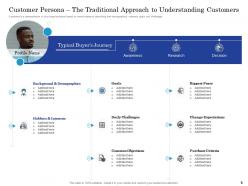
Slide 6: This slide presents Customer Persona - Traditional Approach to understanding customers.
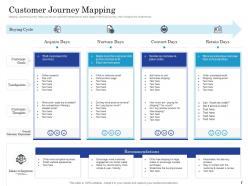
Slide 7: This slide presents customer journet mapping that helps you list out customer interactions at each stage of the buyer journey, their thoughts and experiences.
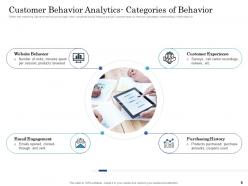
Slide 8: This slide presents Customer Behavior Analytics- Categories of Behavior.
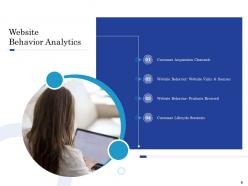
Slide 9: This slide presents Website Behavior Analytics.
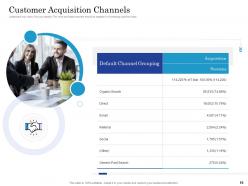
Slide 10: This slide presents Customer Acquisition Channels.
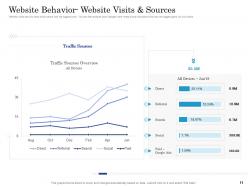
Slide 11: This slide presents Website Behavior- Website Visits & Sources.
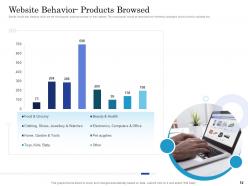
Slide 12: This slide presents Website Behavior- Products Browsed.
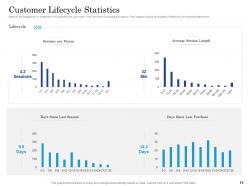
Slide 13: This slide presents Customer Lifecycle Statistics.
Slide 14: This slide present Purchasing Behavior Analytics.
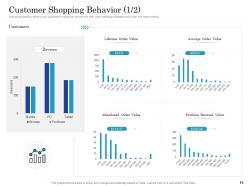
Slide 15: This slide presents Customer Shopping Behavior.
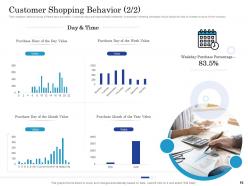
Slide 16: This slide presents Customer Shopping Behavior (2/2).
Slide 17: This slide presents Email Engagement Metrics.
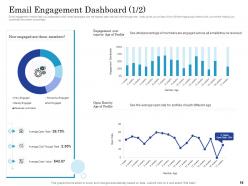
Slide 18: This slide presents Email Engagement Dashboard (1/2).
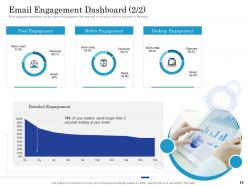
Slide 19: This slide presents Email Engagement Dashboard (1/2).
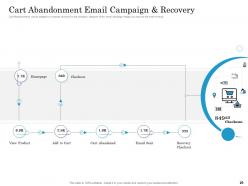
Slide 20: This slide presents Cart Abandonment Email Campaign & Recovery.
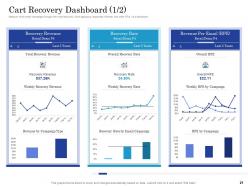
Slide 21: This slide presents Cart Recovery Dashboard.
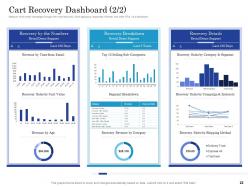
Slide 22: This slide presents Cart Recovery Dashboard (2/2).
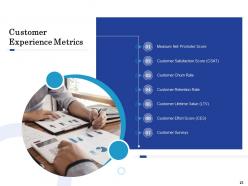
Slide 23: This slide presents Customer Experience Metrics.
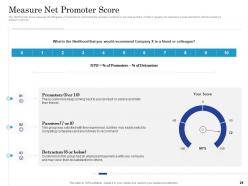
Slide 24: This slide presents Measure Net Promoter Score.
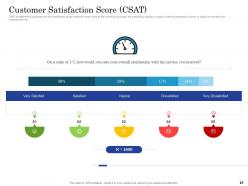
Slide 25: This slide presents Customer Satisfaction Score (CSAT).
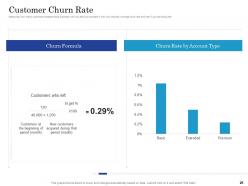
Slide 26: This slide presents Customer Churn Rate.
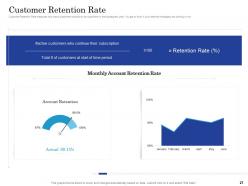
Slide 27: This slide presents that customer Retention Rate measures how many customers continue to be customers in the subsequent year.
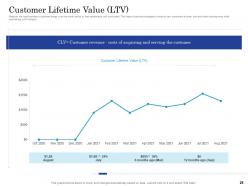
Slide 28: This slide presents Customer Lifetime Value (LTV).
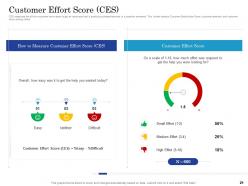
Slide 29: This slide presents that CES measures the effort a customer has to exert to get an issue resolved, a product purchased/returned or a question answered.
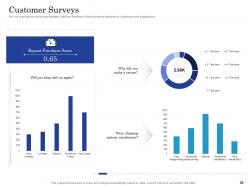
Slide 30: This slide presents Roll out customer surveys to get detailed customer feedback of their shopping experience, challenges and suggestions.
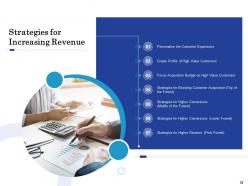
Slide 31: This slide presents Strategies for Increasing Revenue.
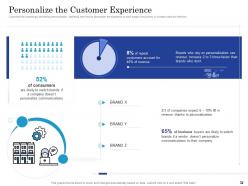
Slide 32: This slide presents Personalize the Customer Experience.
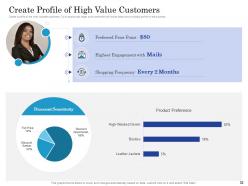
Slide 33: This slide talks about Highest Engagement with Mails.
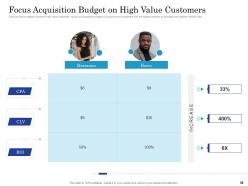
Slide 34: This slide presents Focus Acquisition Budget on High Value Customers.
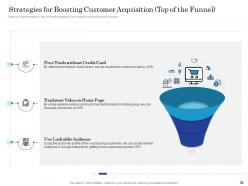
Slide 35: This slide presents Strategies for Boosting Customer Acquisition (Top of the Funnel).
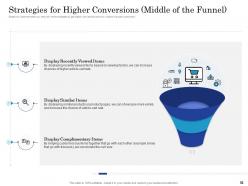
Slide 36: This slide presents Strategies for Higher Conversions (Middle of the Funnel).
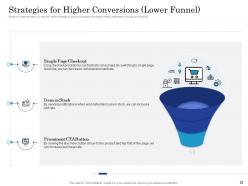
Slide 37: This slide presents Strategies for Higher Conversions (Lower Funnel).
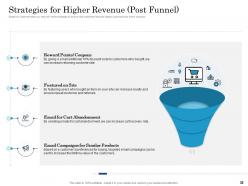
Slide 38: This slide presents Strategies for Higher Revenue (Post Funnel).
Slide 39: This is an Icon Slide. Use it as per your needs.
Slide 40: This is an Additional Slide.
Slide 41: This is a Company Introduction slide that can be used to give a brief overview of the company.
Slide 42: This is Our Mission slide to state your mission and vision.
Slide 43: This is Our Goals slide that can be used to present your goals and aspirations.
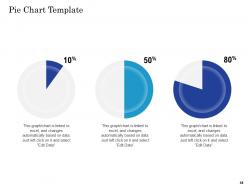
Slide 44: This is a Pie Chart Template that can be used to summarize large data in visual form.
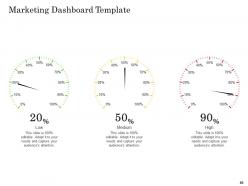
Slide 45: This is a Marketing Dashboard Template to present key performance indicators.
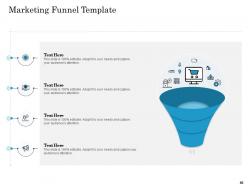
Slide 46: This is a Marketing Funnel Template that can be used to simplify the customer journey.
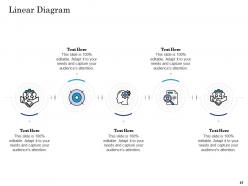
Slide 47: This is a Linear Diagram slide that can be used to present seried of diffent elements.
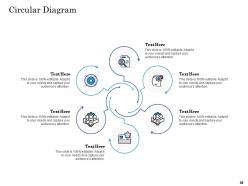
Slide 48: This is a Circular Diagram slide that can be used to present continous series of events.
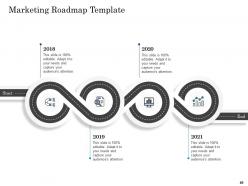
Slide 49: This is a Marketing Roadmap Template that can be used to present series of events.
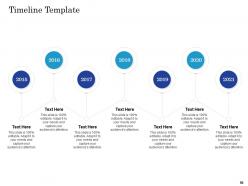
Slide 50: This is a Timeline slide that can be used to present chronological sequence of events.
Slide 51: This is a Thank You slide for acknowledgment.
Getting started with customer behavioral analytics powerpoint presentation slides with all 51 slides:
Use our Getting Started With Customer Behavioral Analytics Powerpoint Presentation Slides to effectively help you save your valuable time. They are readymade to fit into any presentation structure.
FAQs for Getting started with customer behavioral analytics
Primary metrics in customer behavioral analytics include page views, click-through rates, session duration, conversion rates, bounce rates, cart abandonment rates, and customer lifetime value. These metrics enable businesses to optimize user experiences, personalize marketing campaigns, and improve product offerings, with many retail and e-commerce organizations finding that combining these insights ultimately delivers higher engagement and increased revenue.
Businesses leverage customer behavioral analytics by tracking user interactions, analyzing navigation patterns, identifying pain points, and personalizing content delivery across their platforms. Through real-time data insights, companies like e-commerce retailers and streaming services can optimize interface design, streamline checkout processes, and deliver targeted recommendations, ultimately enhancing user satisfaction while increasing conversion rates and customer retention.
Data visualization transforms complex customer behavioral analytics into actionable insights by presenting patterns, trends, and anomalies through interactive dashboards, heat maps, and real-time charts. These visual tools enable marketing teams, retail managers, and customer success departments to quickly identify purchasing behaviors, engagement patterns, and churn indicators, ultimately delivering faster decision-making and enhanced customer experiences.
Customer demographics significantly influence behavioral trends by shaping purchasing patterns, channel preferences, product interests, and engagement timing across different age groups, income levels, and geographic regions. Analytics reveal that millennials favor mobile interactions while older demographics prefer traditional channels, with retail and financial services finding that demographic-targeted strategies enhance conversion rates, optimize marketing spend, and ultimately deliver more personalized customer experiences.
Effective tools include web analytics platforms like Google Analytics, heat mapping software, CRM systems, social media monitoring tools, and AI-powered predictive analytics solutions. These technologies streamline data collection by tracking customer interactions, purchase patterns, and engagement metrics across multiple touchpoints, with many retailers and financial services companies finding that integrated analytics platforms ultimately deliver deeper customer insights and enhanced personalization capabilities.
Machine learning enhances customer behavioral prediction accuracy through advanced pattern recognition, real-time data processing, predictive modeling algorithms, and automated feature selection from vast datasets. These technologies enable retailers, banks, and streaming services to anticipate purchasing decisions, detect fraud patterns, and personalize recommendations with significantly higher precision, ultimately delivering improved customer experiences and competitive advantage.
Companies ensure privacy compliance in behavioral analytics by implementing data anonymization, obtaining explicit user consent, conducting regular privacy audits, and establishing clear data retention policies. Through strategic combination of GDPR-compliant frameworks and transparent data practices, organizations streamline regulatory adherence while maintaining analytical capabilities, ultimately delivering customer insights and competitive advantage without compromising trust.
Key implementation challenges include data integration complexities, privacy compliance requirements, skill gaps in analytics teams, technology infrastructure limitations, and translating insights into actionable strategies. While these obstacles can initially slow deployment, businesses increasingly find that strategic planning, proper training, and phased rollouts enable successful analytics programs, ultimately delivering enhanced customer understanding and competitive advantage.
Customer behavioral insights enable targeted marketing campaigns by analyzing purchase patterns, browsing history, engagement metrics, and demographic preferences to create personalized content and offers. These analytics help businesses segment audiences more precisely, optimize campaign timing and channels, and deliver relevant messaging that resonates with specific customer groups, ultimately increasing conversion rates and marketing ROI while reducing acquisition costs.
Customer feedback significantly impacts behavioral analytics strategies by providing qualitative context to quantitative data patterns, revealing customer motivations behind observed behaviors, and identifying gaps between actual experiences and predicted models. This strategic combination enables organizations to refine their analytics algorithms, enhance personalization accuracy, and deliver more targeted customer experiences, with many retailers and financial services finding that integrated feedback loops ultimately improve customer satisfaction and drive higher conversion rates.
Customer segmentation through behavioral analytics involves analyzing purchase patterns, website interactions, engagement frequencies, product preferences, and transaction histories to identify distinct customer groups. These data-driven insights enable businesses to create targeted segments like high-value frequent buyers, price-sensitive customers, and seasonal shoppers, ultimately delivering personalized marketing strategies and enhanced customer experiences across retail, e-commerce, and financial services sectors.
Quantitative approaches focus on numerical data like purchase frequency, website clicks, conversion rates, and customer lifetime value, while qualitative methods examine motivations, preferences, and emotions through surveys, interviews, and feedback analysis. Many retail and financial services companies combine both approaches, with quantitative data revealing what customers do and qualitative insights explaining why, ultimately delivering comprehensive customer understanding and strategic advantage.
Businesses measure long-term effectiveness through customer lifetime value improvements, retention rate increases, conversion optimization metrics, and revenue attribution analysis from targeted campaigns. These measurements enable organizations to track behavioral pattern predictions against actual outcomes, with many retailers and financial services finding that sustained engagement improvements and reduced churn ultimately deliver measurable competitive advantage.
**INPUT**: What case studies best illustrate the successful application of customer behavioral analytics in driving revenue growth? **OUTPUT**: Leading case studies include Amazon's recommendation engine driving 35% of sales, Netflix's viewing analytics reducing churn by 25%, and Starbucks' mobile app analytics increasing customer frequency by 15%. These implementations demonstrate how behavioral insights enable personalized experiences, optimize pricing strategies, and enhance customer lifetime value, with retail and entertainment sectors finding that data-driven personalization ultimately delivers significant competitive advantage and measurable revenue growth.
Behavioral analytics reduces customer churn by identifying at-risk customers through engagement patterns, purchase frequency, and usage decline indicators, enabling proactive intervention strategies. Banks and telecom companies leverage predictive models to trigger personalized retention offers, targeted communication campaigns, and improved service experiences, ultimately reducing churn rates by 15-30% while enhancing long-term customer lifetime value.
-
Understandable and informative presentation.
-
Presentation Design is very nice, good work with the content as well.
-
Appreciate the research and its presentable format.
-
Unique research projects to present in meeting.
-
Very unique and reliable designs.
-
Understandable and informative presentation.
-
Professional and unique presentations.
-
Very unique and reliable designs.
-
Great quality slides in rapid time.
-
Enough space for editing and adding your own content.