


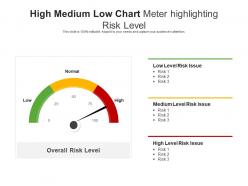
High medium low chart meter highlighting risk level





Try Before you Buy Download Free Sample Product
 Impress Your
Audience
 100%
Editable
 Save Hours
of Time


Our High Medium Low Chart Meter Highlighting Risk Level are topically designed to provide an attractive backdrop to any subject. Use them to look like a presentation pro.
People who downloaded this PowerPoint presentation also viewed the following :
High medium low chart meter highlighting risk level with all 2 slides:
Use our High Medium Low Chart Meter Highlighting Risk Level to effectively help you save your valuable time. They are readymade to fit into any presentation structure.

FAQs for High medium low chart meter
So you need four key things for a decent risk assessment chart. Start by listing out each risk and what could actually go wrong. Rate how likely each one is to happen - I stick with 1-5 because anything more complex gets messy. Then figure out the impact if it does happen, using the same scale. Multiply likelihood times impact to get your risk score. Honestly, the biggest mistake people make is being inconsistent with ratings. Your team has to agree upfront what "likely" means, otherwise you'll get wildly different scores and the whole thing becomes useless.
So basically you'll want to dig into past data and current conditions to figure out how likely each risk actually is. Then assess the damage it could do - money, operations, your company's reputation, whatever applies. Honestly, I just use a 1-5 scale for both likelihood and impact, though some people do the low/medium/high thing instead. Just stay consistent with your criteria. Get input from folks who deal with these risks daily - they know way more than spreadsheets do. Write down why you rated things the way you did. Trust me, you'll forget your reasoning in six months when everything changes.
Heat maps work really well for risk stuff - you can instantly see the problem areas with color coding. Matrix charts are solid too, like those 3x3 grids that bosses always want to see. Scatter plots are good when you're plotting individual risks by probability vs impact. Don't bother with pie charts though, they're basically useless here. Oh, and make your colors obvious - red for bad stuff, green for good. I learned this the hard way but clear labels are crucial or people will just stare at your chart confused.
Honestly, these charts are game-changers for figuring out which risks you should actually worry about. Plot everything by how likely it is versus how much damage it'd do - then boom, you can see what needs fixing right now and what can wait. Way easier than trying to explain a boring list to your boss or teammates. During planning meetings, use it to decide where to throw your budget and energy. Obviously tackle the high-impact, high-probability stuff first. Then work down from there. Oh and don't forget to update it as things change - projects evolve constantly.
Hey! So for risk charts, most people just use Excel or Google Sheets - honestly works fine for basic heat maps. Lucidchart's pretty solid if you need something more visual, and Visio too but it's kinda clunky. Teams doing serious ongoing stuff usually go with dedicated GRC platforms like ServiceNow, though those get pricey fast. Oh, and Miro's actually great for brainstorming risks with your team - didn't expect to like it as much as I do. I'd just start with whatever you've got access to. Simple Excel matrix might do the trick.
So basically you plot risks on a grid - probability vs impact. The nasty combo is high chance + high damage, those go straight to the top. I mean, nobody wants to be blindsided by something they saw coming, right? Medium stuff gets handled later when you have bandwidth. Low risk/low impact? Just keep an eye on them. You could do some complicated scoring system but honestly the simple visual matrix works fine for most things. Start with those scary top-right corner risks and work down from there.
Don't be vague - "high risk" means nothing if you can't explain the actual impact. Get specific about what could go wrong and how likely it really is. Those online templates? Total garbage most of the time, so don't just copy them. You need other people's input too since you'll miss stuff on your own. Oh, and here's the thing everyone screws up - they make it once then never touch it again. Your risk chart needs regular updates or it becomes useless pretty fast. Things change constantly in projects.
Yeah totally! Start with a basic 5x5 matrix then tweak the categories for your specific industry. Healthcare would focus on patient safety stuff and infection risks. Manufacturing's more about equipment breaking down and worker injuries. Construction - well, that's falls, structural problems, heavy machinery accidents. The trick is changing your probability ratings and impact levels to actually reflect what happens in your field. Base it on your industry regs and the incidents that come up most often. Way more useful than some generic template that doesn't really fit. Honestly makes the whole exercise actually worth doing instead of just checking a box.
So basically, risk assessment charts are like having a crystal ball for your project (well, sort of). You list out everything that could go sideways, figure out how likely each thing is, and rank the potential damage. I always tell people to build theirs during planning phase - don't wait until stuff starts hitting the fan. Update it regularly too, otherwise it just sits there collecting digital dust. The whole point is keeping your team on the same page about what threats you're actually worried about. Honestly, it's way better than scrambling when problems pop up unexpectedly.
Look, once a year is the absolute minimum but don't just stick to that. Major changes? New regulations? Some incident that makes you go "oh crap"? Update it then. I've watched teams just file these away and never touch them again - which is pretty much pointless. Quarterly check-ins work better than waiting for your calendar reminder. Actually, get your team in the habit of speaking up when something shifts that could mess with your risk levels. Way more effective than treating it like some annual chore you have to get through.
So you want to track risk reduction percentage and time to resolution - those are your bread and butter metrics. Show execs how many high-priority risks dropped to lower levels over time, plus average days to fix each risk tier. Honestly, I always add a "risks prevented" number even though it's kinda squishy because leadership eats that proactive stuff up. Cost-effectiveness ratios work too - what you spent vs. potential damage avoided. Oh, and resource allocation efficiency if you're feeling fancy. Start there and you'll actually have proof your risk stuff isn't just busy work.
So here's what I'd do - grab your hard numbers first (incident rates, financial losses, that stuff) to build your basic risk matrix. Then add the squishy but crucial stuff like regulatory headaches or reputation hits. Most teams I've worked with just slap numerical weights on the qualitative bits so it all fits one chart. Quick tip though - you'll want everyone defining "high reputational risk" the same way or your assessments will be all over the place. Actually had a team once where half thought it meant Twitter backlash and half meant actual revenue loss. Total mess.
Honestly, you're just guessing at what could go wrong without some kind of risk chart. Teams I've worked with always end up focusing on the wrong stuff - spending weeks worrying about tiny issues while the real problems sneak up on them. It's wild how often this happens. You can't figure out what needs fixing now versus what you can deal with later. Also, when stakeholders ask about risk management (and they will), "oh we talked about it" sounds pretty weak. Just make a simple grid - probability on one side, impact on the other. Takes like an hour but saves you so much headache later.
Red for high risk, yellow for medium, green for low - pretty standard stuff. Don't overthink the colors. Skip the jargon though, seriously. Half the people reading these things aren't risk nerds like us. I'd test it with someone first - maybe grab a colleague and see if they get confused. Consistent fonts help too, nothing fancy. Oh, and actually define what "high risk" means with real criteria, not some wishy-washy description. Committee-designed charts are the worst. You want people to glance at it and immediately know what's going on.
Look, risk assessment charts are basically your compliance roadmap. They help you spot and rank risks systematically - which most regulations like SOX or GDPR actually require you to document anyway. Auditors always want to see this stuff, so you're not just checking boxes. You're proving you've identified potential gaps and have actual plans to fix them. Trust me, having everything mapped out beforehand makes audit season way less painful (learned that the hard way). Check what documentation your specific regs require first, then build your charts around those requirements.
-
Great quality slides in rapid time.