

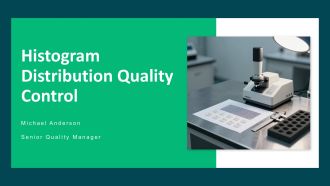
Histogram Distribution Quality Control PPT Presentation VA





Try Before you Buy Download Free Sample Product
 Impress Your
Audience
 100%
Editable
 Save Hours
of Time


Master histogram analysis for distribution quality control in this professional PowerPoint deck. Learn to identify process variation detect defects and improve manufacturing standards using practical charting techniques. Ideal for engineers and quality managers seeking data driven decision making tools and actionable insights.
Uneven product dimensions and inconsistent output often slip past standard checks until a customer notices. That is where a sharp eye on distribution patterns becomes your best defense. This presentation deck translates histogram analysis into a practical quality control workflow showing you how to spot variation identify outliers and pinpoint process shifts before they turn into costly defects. With clear data visualization and editable slides you can walk your team through real examples explain tolerance limits and build a shared understanding of statistical thinking. These PPT slides help you turn raw measurement data into a compelling story about precision consistency and continuous improvement perfect for training sessions or leadership reviews.
People who downloaded this PowerPoint presentation also viewed the following :
Histogram Distribution Quality Control PPT Presentation VA with all 37 slides:
Use our Histogram Distribution Quality Control PPT Presentation VA to effectively help you save your valuable time. They are readymade to fit into any presentation structure.









Most Relevant Reviews
No Reviews