

Human Resource Diversity Dashboard Based On Demographics





Try Before you Buy Download Free Sample Product
 Impress Your
Audience
 100%
Editable
 Save Hours
of Time


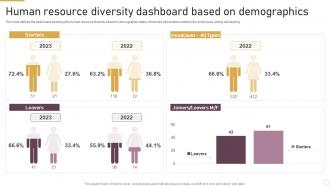
This slide defines the dashboard analyzing the human resource diversity based on demographic status. It includes information related to the employees joining and leaving.
People who downloaded this PowerPoint presentation also viewed the following :
Human Resource Diversity Dashboard Based On Demographics with all 7 slides:
Use our Human Resource Diversity Dashboard Based On Demographics to effectively help you save your valuable time. They are readymade to fit into any presentation structure.






FAQs for Human Resource Diversity Dashboard
A Human Resource Diversity Dashboard should include representation metrics across demographics, recruitment conversion rates, promotion and retention rates by group, pay equity analysis, and employee engagement scores. These metrics work together by identifying gaps, tracking progress, and measuring impact, with many organizations finding that comprehensive dashboards enable targeted interventions, improve accountability, and ultimately deliver more equitable workplaces and stronger business performance.
Organizations utilize Diversity Dashboards to enhance recruitment by tracking candidate demographics, identifying pipeline gaps, monitoring sourcing channel effectiveness, and measuring bias in selection processes. These analytics enable HR teams to adjust job posting strategies, expand sourcing networks, and implement targeted outreach programs, ultimately delivering more inclusive hiring practices and building competitive talent pools across all organizational levels.
Data visualization transforms complex diversity metrics into accessible insights by presenting demographic breakdowns, progression trends, pay equity analyses, and retention patterns through interactive charts and graphs. These visual representations enable HR leaders and executives to quickly identify disparities across departments, track improvement initiatives, and communicate diversity outcomes to stakeholders, ultimately facilitating data-driven decisions that enhance organizational inclusivity and competitive advantage.
Annual diversity audits provide comprehensive data analysis that can reveal gaps in current dashboard metrics, highlight emerging diversity trends, and identify new areas requiring measurement such as promotion rates, retention patterns, and intersectional representation. These audit findings enable organizations to refine their dashboard focus, add relevant KPIs like pay equity ratios or leadership pipeline diversity, and ultimately deliver more strategic insights that drive meaningful organizational change and competitive advantage.
Effective HR diversity dashboards utilize business intelligence platforms like Tableau, Power BI, and Qlik Sense, alongside specialized HR analytics tools such as Workday, BambooHR, and Culture Amp. These technologies streamline data visualization, automate compliance reporting, and enhance workforce analytics, with many organizations finding that integrated platforms deliver real-time insights and strategic diversity metrics, ultimately enabling data-driven inclusion strategies.
Companies ensure diversity dashboard accuracy through regular data audits, automated validation systems, standardized collection processes, employee self-reporting verification, and third-party compliance reviews. These methodologies streamline data integrity by eliminating inconsistencies, cross-referencing multiple sources, and implementing real-time monitoring, with many organizations finding that systematic validation ultimately delivers transparent reporting and enhanced strategic decision-making capabilities.
**INPUT**: What steps can be taken to promote transparency and accountability using a Diversity Dashboard? **OUTPUT**: Organizations can promote transparency by sharing diversity metrics openly with employees, setting measurable goals with regular progress updates, and establishing clear accountability structures for leadership teams. These dashboards enable companies to track representation across departments, monitor recruitment and retention patterns, and measure pay equity outcomes, with many organizations finding that visible metrics drive meaningful cultural change and strategic diversity initiatives. **Word count: 60 words**
A Diversity Dashboard enables organizations to monitor diversity metrics through comprehensive data visualization, tracking recruitment patterns, retention rates, promotion statistics, and demographic distributions across departments and leadership levels. These dashboards streamline progress measurement by providing real-time analytics, benchmarking capabilities, and trend identification, ultimately delivering actionable insights that enhance strategic decision-making and accountability in diversity efforts.
A Diversity Dashboard assists retention by tracking turnover patterns across demographic groups, identifying pay equity gaps, monitoring promotion rates, and analyzing employee satisfaction scores by diversity metrics. Through real-time analytics, organizations can proactively address retention risks, implement targeted mentorship programs, and create inclusive advancement pathways, ultimately reducing turnover costs while building stronger, more diverse teams.
Potential pitfalls include oversimplifying complex diversity metrics, focusing on vanity numbers rather than meaningful outcomes, inadequate data privacy protections, resistance from leadership lacking diversity commitment, and creating dashboards without clear action plans. While these challenges exist, organizations increasingly find that addressing them proactively through stakeholder engagement, comprehensive training, and strategic integration ultimately delivers more authentic diversity initiatives and sustainable cultural transformation.
Employee feedback integrates into diversity dashboard metrics through pulse surveys, focus groups, exit interviews, anonymous reporting systems, and sentiment analysis tools. These feedback mechanisms enhance quantitative data by providing qualitative insights into workplace culture, identifying specific bias incidents, and measuring inclusion effectiveness, ultimately delivering a comprehensive view of diversity initiatives with many organizations finding that employee perspectives reveal gaps traditional metrics miss.
Organizations should establish benchmarks including representation percentages across all levels, pay equity ratios, retention rates by demographic groups, promotion velocity metrics, and inclusion survey scores. These benchmarks enable HR teams to track progress systematically, identify gaps in leadership pipelines and compensation structures, and measure cultural transformation, with many companies finding that setting industry-comparative targets ultimately delivers improved talent acquisition and enhanced organizational performance.
A Diversity Dashboard facilitates meaningful conversations by providing objective data on representation, pay equity, promotion rates, and employee engagement across different demographics, creating transparency that moves discussions beyond assumptions. This data-driven approach enables HR teams and leadership to identify specific gaps, track cultural initiatives, and engage in constructive dialogue about inclusion strategies, ultimately fostering accountability and measurable progress toward more inclusive workplace environments.
A Diversity Dashboard enables comparative analysis across demographic representation, pay equity ratios, promotion rates by group, retention percentages, and leadership diversity metrics against industry benchmarks. Through comprehensive data visualization, organizations can identify performance gaps, track competitive positioning, and measure progress against sector standards, with many companies finding that regular benchmarking drives strategic improvements and enhances their employer brand competitiveness.
A Diversity Dashboard influences leadership decisions by providing real-time metrics on representation, pay equity, promotion rates, and inclusion indicators across departments and levels. These data-driven insights enable executives to identify gaps, set targeted goals, and allocate resources strategically, with many organizations finding that transparent diversity metrics drive accountability and accelerate progress toward inclusive workplace cultures.
-
Colors used are bright and distinctive.
-
SlideTeam provides PPTs on every single topic. Their templates suit my job very well. I am very grateful!