Improve business efficiency by optimizing business process powerpoint presentation slides
Exhibit detailed information with our improve business efficiency by optimizing business process PowerPoint presentation slides. This upgrade profession PPT deck enables the audience to understand the key steps of process improvement in the banking sector. The slides in this enhancing work PowerPoint layout provides information related to key challenges, opportunities, and benefits of automation in a banking company. By incorporating this boost manufacturing PPT bundle, you will get your hands on the process overview, industry overview, SWOT analysis, strategic steps to improve process, future forecast, and dashboard. Providing a clear image of challenges in this PowerPoint design will assist you in making uninformed decisions to ensure improvement in the business. The graphical representation of all the data in this boost merchandising creative PPT set leaves a positive impact as it gives clarity regarding the ongoing subject matters. Making it much easier for you, this developing dealings PowerPoint set showcases the key opportunities as well as the possible solutions offered by the new process. Download it now to make your presentation standout.
- Google Slides is a new FREE Presentation software from Google.
- All our content is 100% compatible with Google Slides.
- Just download our designs, and upload them to Google Slides and they will work automatically.
- Amaze your audience with SlideTeam and Google Slides.
-
Want Changes to This PPT Slide? Check out our Presentation Design Services
- WideScreen Aspect ratio is becoming a very popular format. When you download this product, the downloaded ZIP will contain this product in both standard and widescreen format.
-

- Some older products that we have may only be in standard format, but they can easily be converted to widescreen.
- To do this, please open the SlideTeam product in Powerpoint, and go to
- Design ( On the top bar) -> Page Setup -> and select "On-screen Show (16:9)” in the drop down for "Slides Sized for".
- The slide or theme will change to widescreen, and all graphics will adjust automatically. You can similarly convert our content to any other desired screen aspect ratio.
Compatible With Google Slides

Get This In WideScreen
You must be logged in to download this presentation.
PowerPoint presentation slides
Presenting our improve business efficiency by optimizing business process PowerPoint presentation slides. This PowerPoint theme is inclusive of forty six slides and each one of them is available for download in both standard and widescreen formats. Easy to edit, this PPT deck is compatible with all popular presentation software such as Microsoft Office, Google Slides, and many others.
People who downloaded this PowerPoint presentation also viewed the following :
Content of this Powerpoint Presentation
Slide 1: This slide is titled “Improve Business Efficiency by Optimizing Business Process.” State your company name and get started.
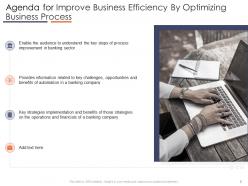
Slide 2: This slide is titled “Agenda for Improving Business Efficiency by Optimizing Business Process.” It enables the audience to understand the key steps of process improvement in the banking sector, provides information related to key challenges, opportunities, benefits of automation in a banking company, etc.
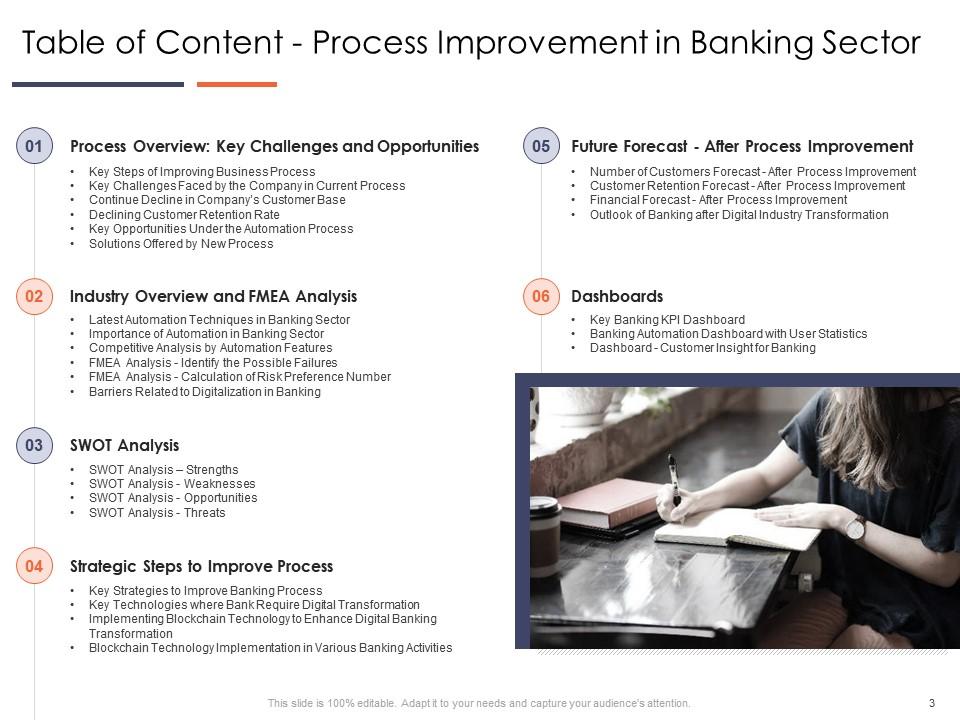
Slide 3: This slide is titled “Table of Content - Process Improvement in Banking Sector.” It includes Process Overview: Key Challenges and Opportunities, SWOT Analysis, Key Steps of Improving Business Process, etc.
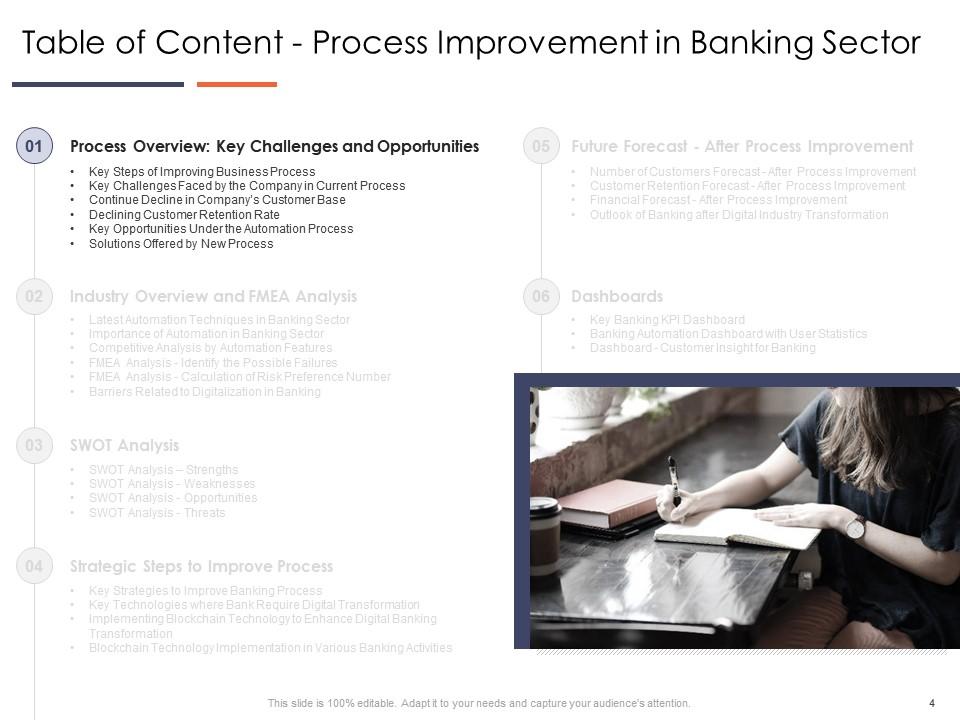
Slide 4: This slide is titled “Table of Content - Process Improvement in Banking Sector.” It shows Process Overview: Key Challenges and Opportunities.
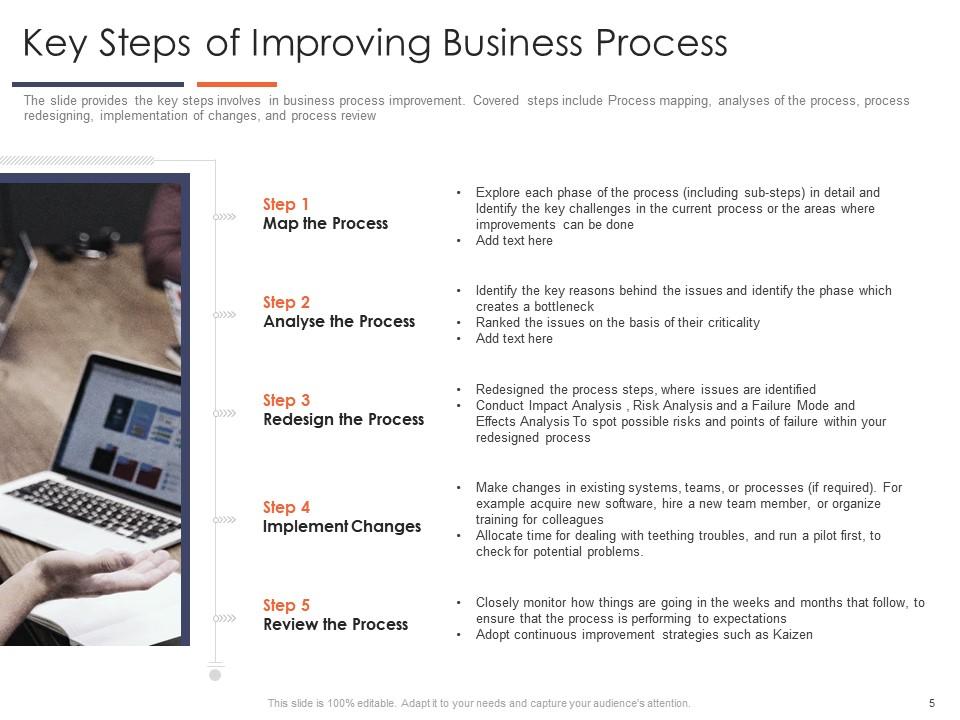
Slide 5: This slide is titled “Key Steps of Improving Business Process.” It provides the key steps involved in business process improvement. Covered steps include process mapping, analyses of the process, process redesigning, implementation of changes, and process review.
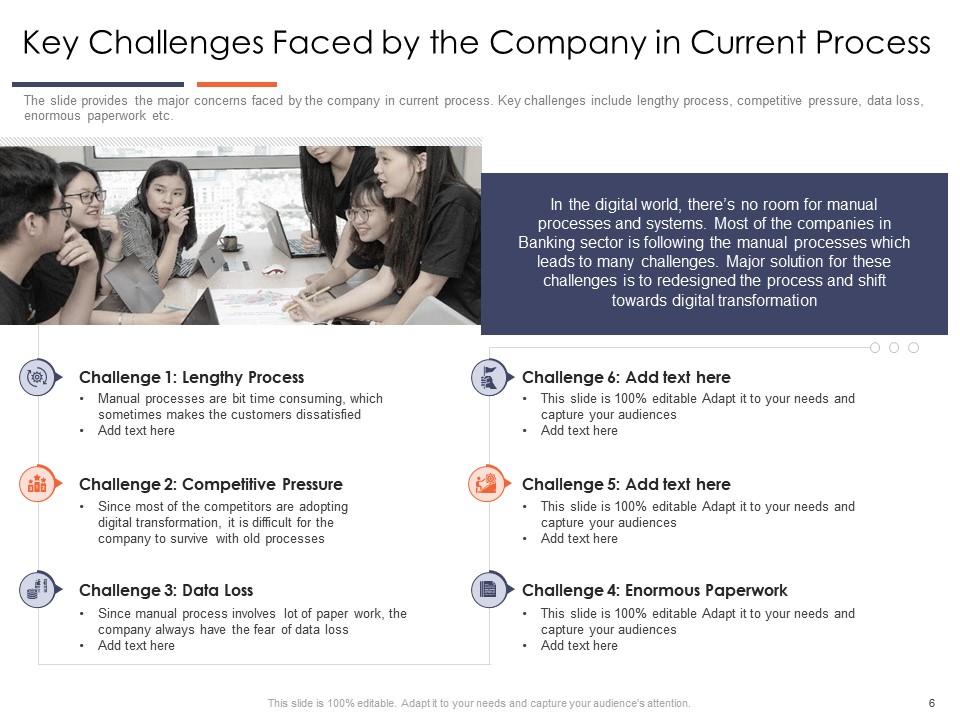
Slide 6: This slide is titled “Key Challenges Faced by the Company in Current Process,” It provides the major concerns faced by the company in the current process. Key challenges include lengthy processes, competitive pressure, data loss, enormous paperwork, etc.
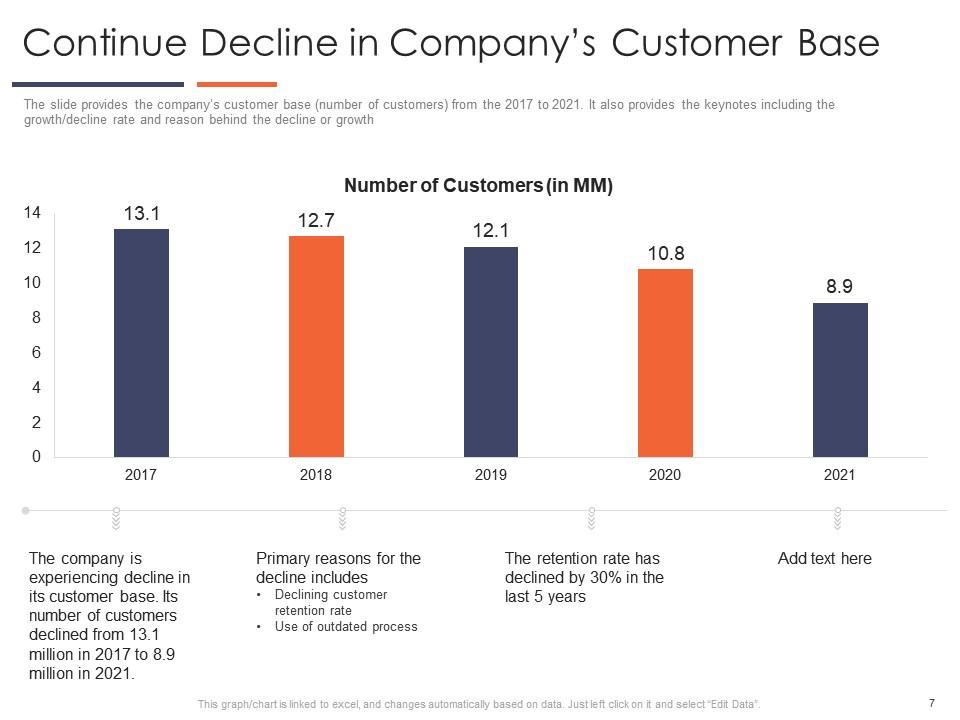
Slide 7: This slide is titled “Continue Decline in Company’s Customer Base.” It provides the company’s customer base (number of customers) from 2017 to 2021. It also provides the keynotes including the growth/decline rate and the reason behind the decline or growth.
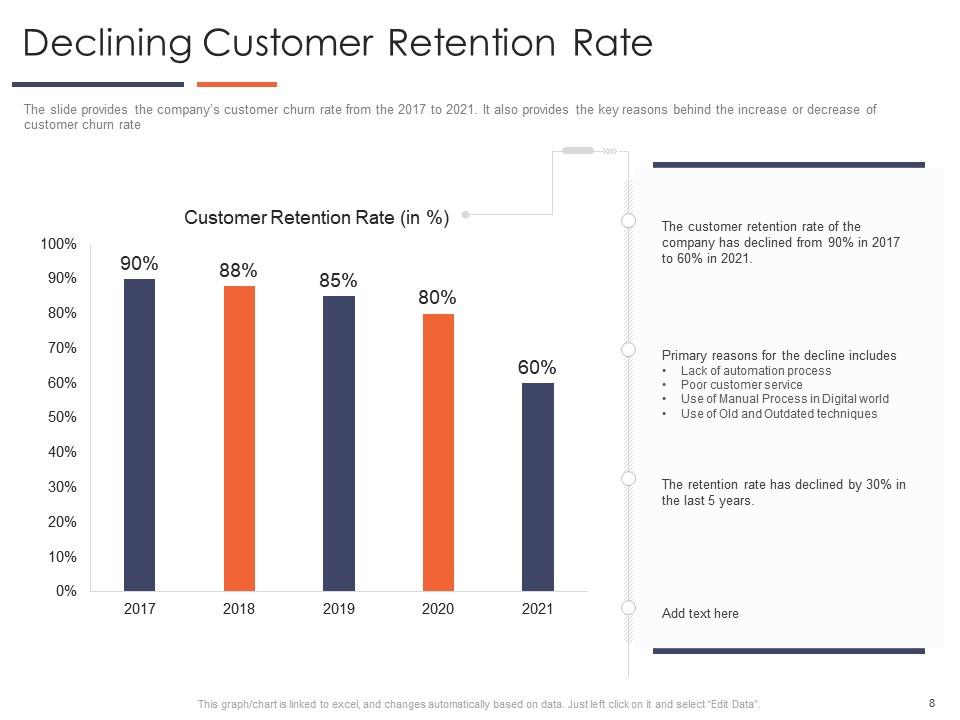
Slide 8: This slide is titled “Declining Customer Retention Rate.” It provides the company’s customer churn rate from 2017 to 2021. It also provides the key reasons behind the increase or decrease of customer churn rate.
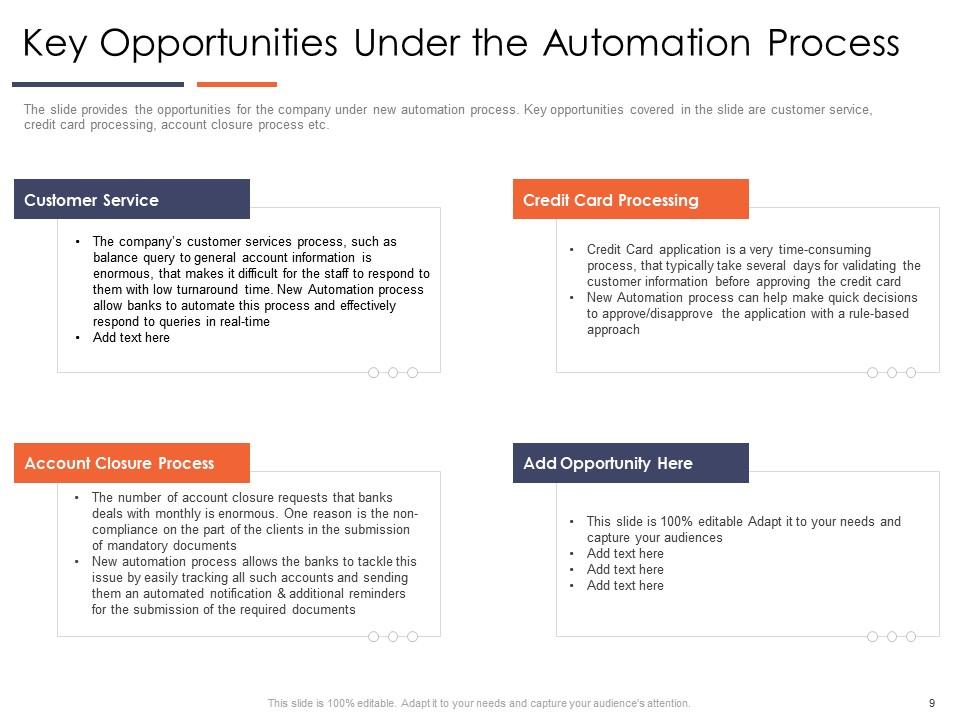
Slide 9: This slide is titled “Key Opportunities Under the Automation Process.” It provides opportunities for the company under the new automation process. Key opportunities covered in the slide are customer service, credit card processing, account closure process, etc.
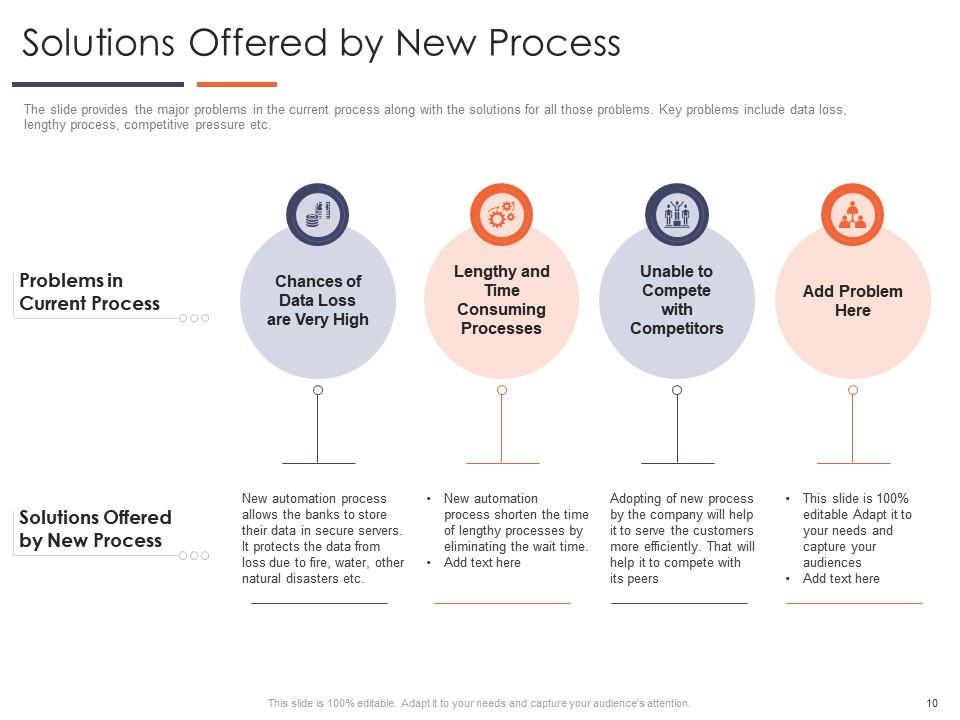
Slide 10: This slide is titled “Solutions Offered by New Process.” It provides the major problems in the current process along with the solutions for all those problems. Key problems include data loss, lengthy processes, competitive pressure, etc.
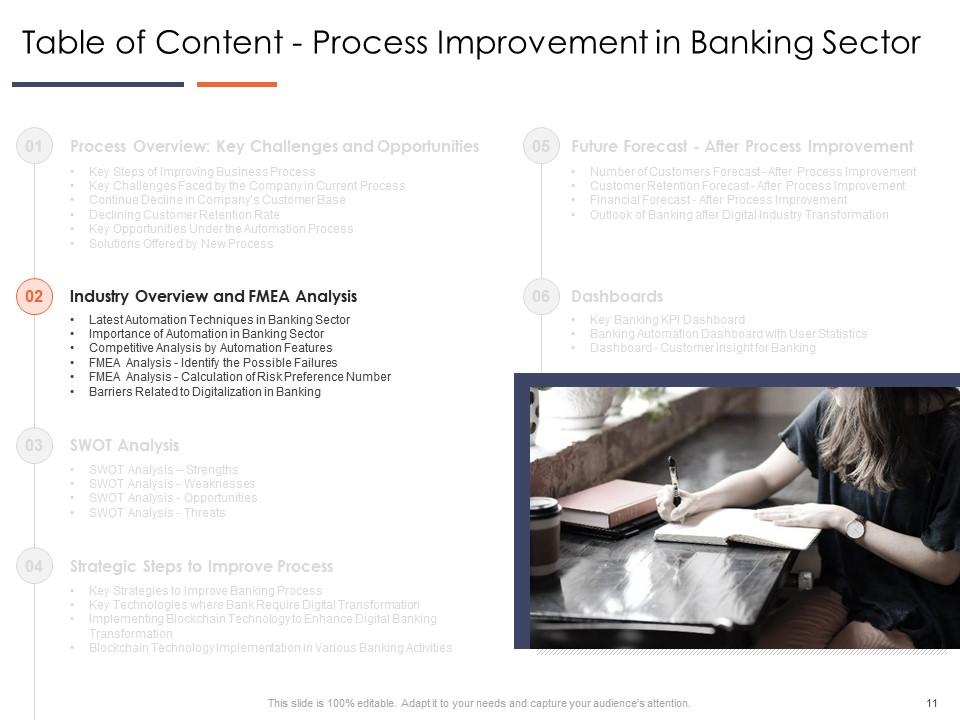
Slide 11: This slide is titled “Table of Content - Process Improvement in Banking Sector.” It includes Industry Overview and FMEA Analysis.
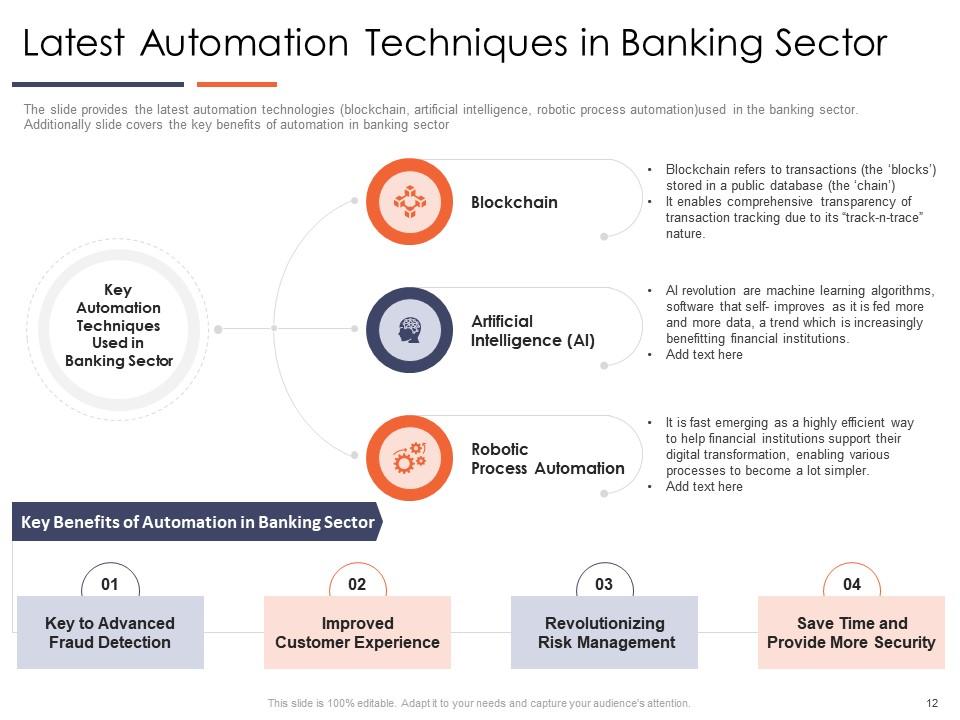
Slide 12: This slide is titled “Latest Automation Techniques in Banking Sector.” It provides the latest automation technologies (blockchain, artificial intelligence, robotic process automation) used in the banking sector.
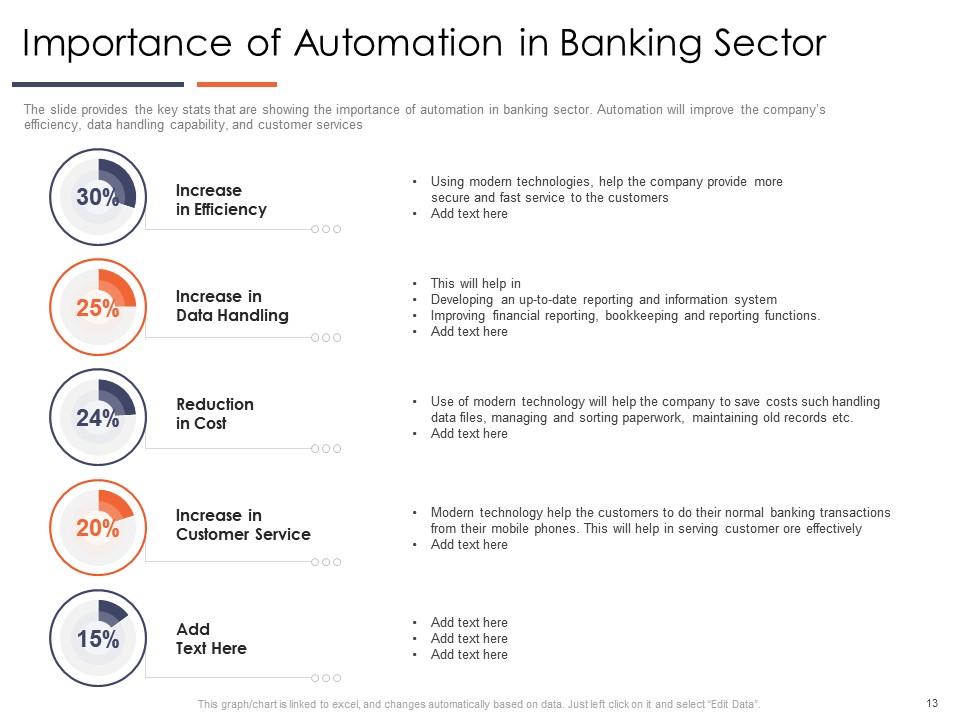
Slide 13: This slide is titled “Importance of Automation in the Banking Sector.” It provides the key stats that show the importance of automation in the banking sector. Automation will improve the company’s efficiency, data handling capability, and customer services.
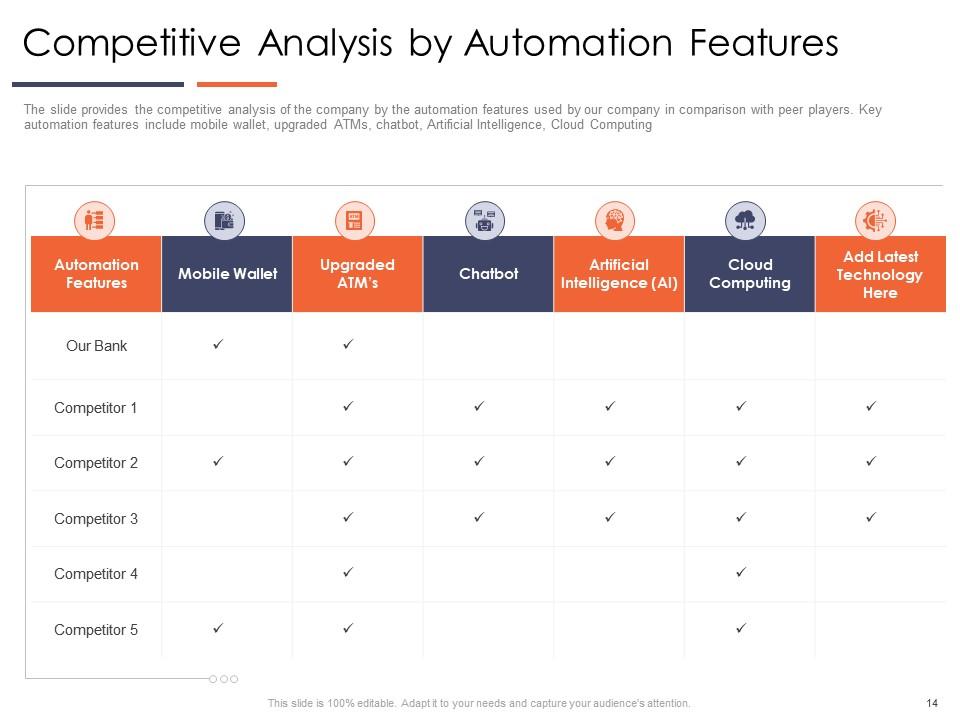
Slide 14: This slide is titled “Competitive Analysis by Automation Features.” It provides the competitive analysis of the company by the automation features used by our company in comparison with peer players.
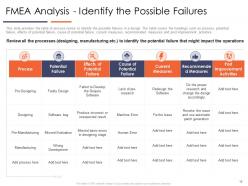
Slide 15: This slide is titled “FMEA Analysis - Identify the Possible Failures.” This slide provides the table of process reviews to identify the possible failures in a design. The table covers the headings such as process, potential failure, effects of potential failure, cause of potential failure, etc.
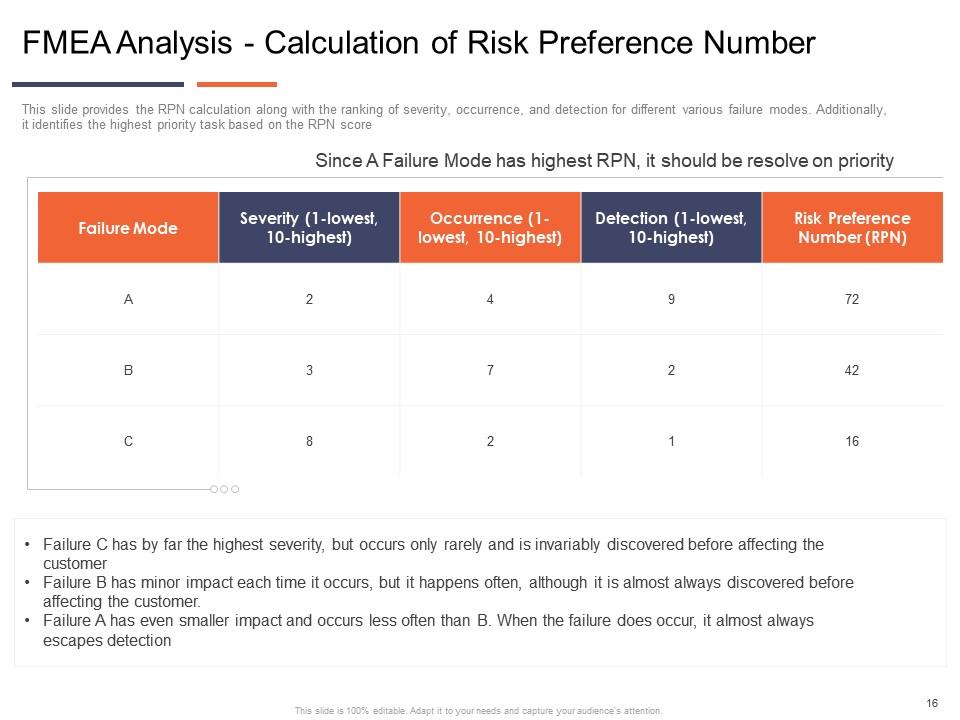
Slide 16: This slide is titled “FMEA Analysis - Calculation of Risk Preference Number.” It provides the RPN calculation along with the ranking of severity, occurrence, and detection for different various failure modes. Additionally, it identifies the highest priority task based on the RPN score.
Slide 17: This slide is titled “Barriers Related to Digitalization in Banking.” It provides the major barriers to digitalization in the banking sector. Key barriers include cultural challenges, technical challenges, lack of digital talent, and lack of innovations.
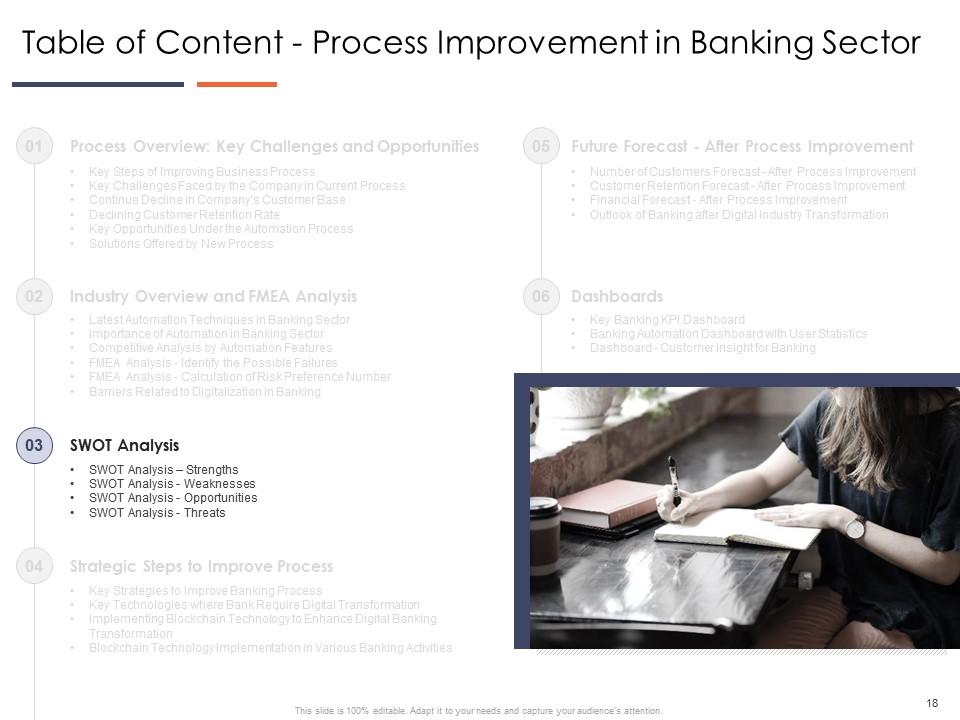
Slide 18: This slide is titled “Table of Content - Process Improvement in Banking Sector.” It includes SWOT Analysis – Strengths, SWOT Analysis – Weaknesses, SWOT Analysis – Opportunities, SWOT Analysis – Threats, and SWOT Analysis.
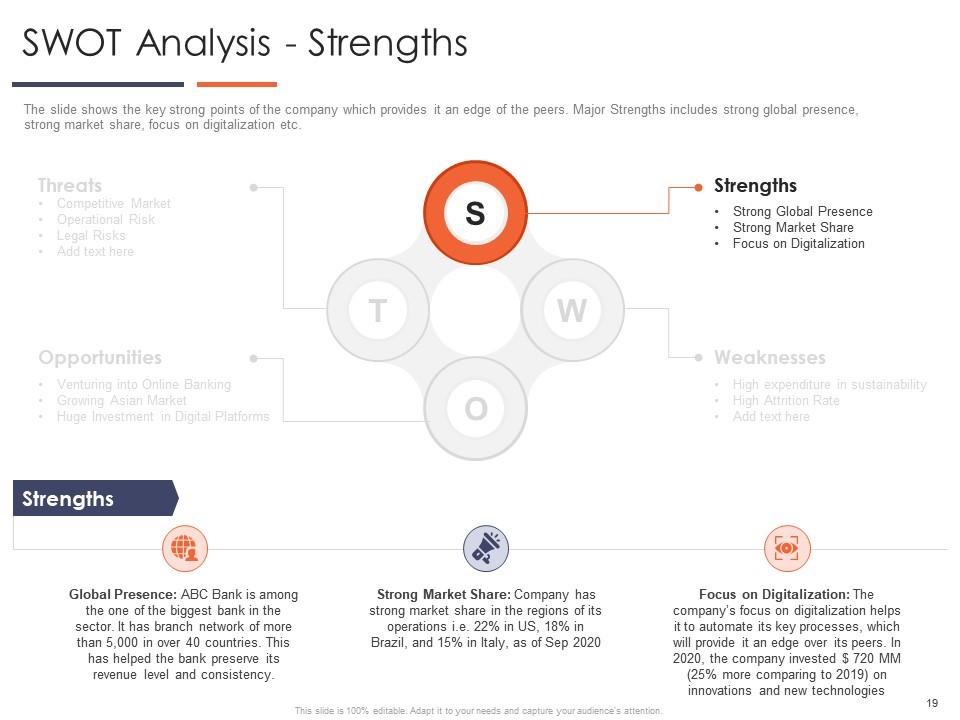
Slide 19: This slide is titled “SWOT Analysis – Strengths.” It shows the key strong points of the company which provides it an edge over its peers. Major Strengths include strong global presence, strong market share, focus on digitalization, etc.
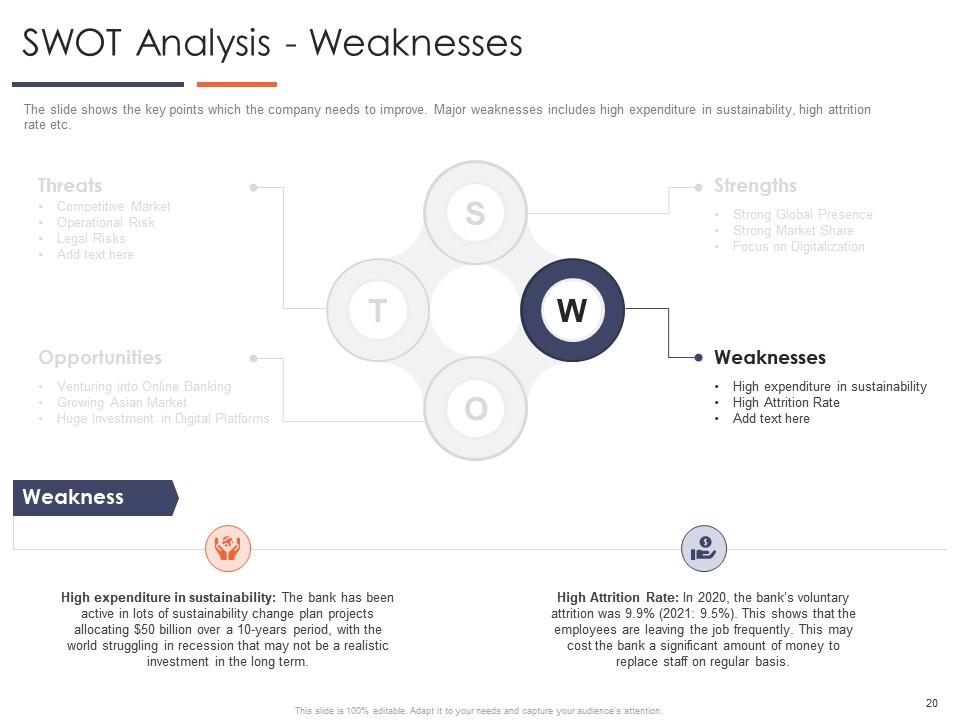
Slide 20: This slide is titled “SWOT Analysis – Weaknesses.” It shows the key areas where the company needs to improve. Major weaknesses include high expenditure in sustainability, high attrition rate, etc.
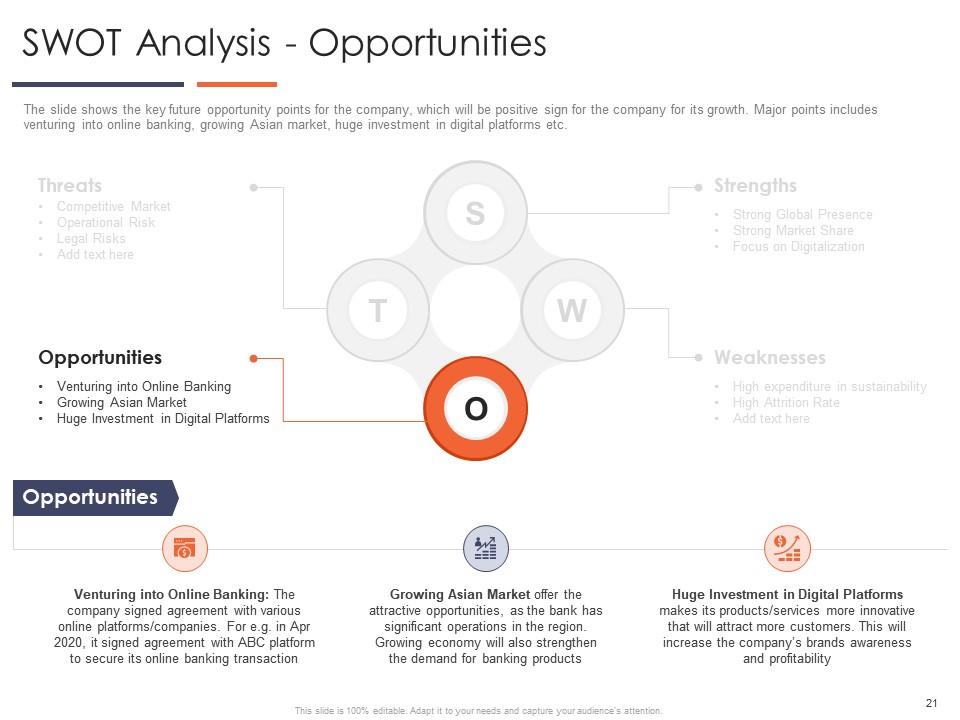
Slide 21: This slide is titled “SWOT Analysis – Opportunities.” It shows the key future opportunity points for the company, which will be a positive sign for the company for its growth. Major points include venturing into online banking, growing Asian market, huge investment in digital platforms, etc.
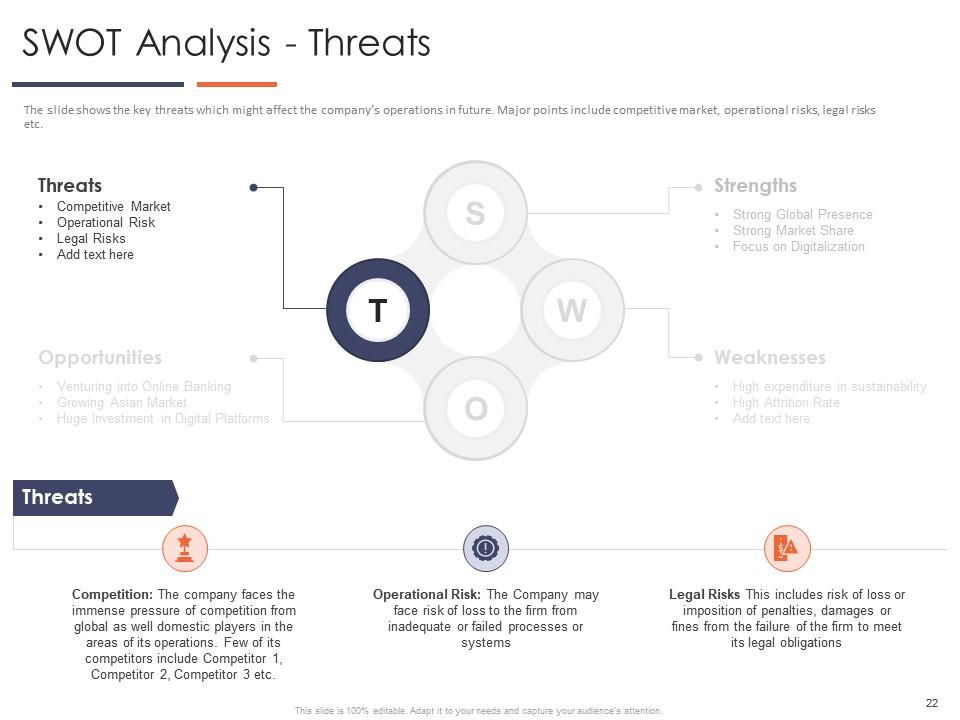
Slide 22: This slide is titled “SWOT Analysis – Threats.” It shows the key threats which might affect the company’s operations in the future. Major points include competitive market, operational risks, legal risks, etc.
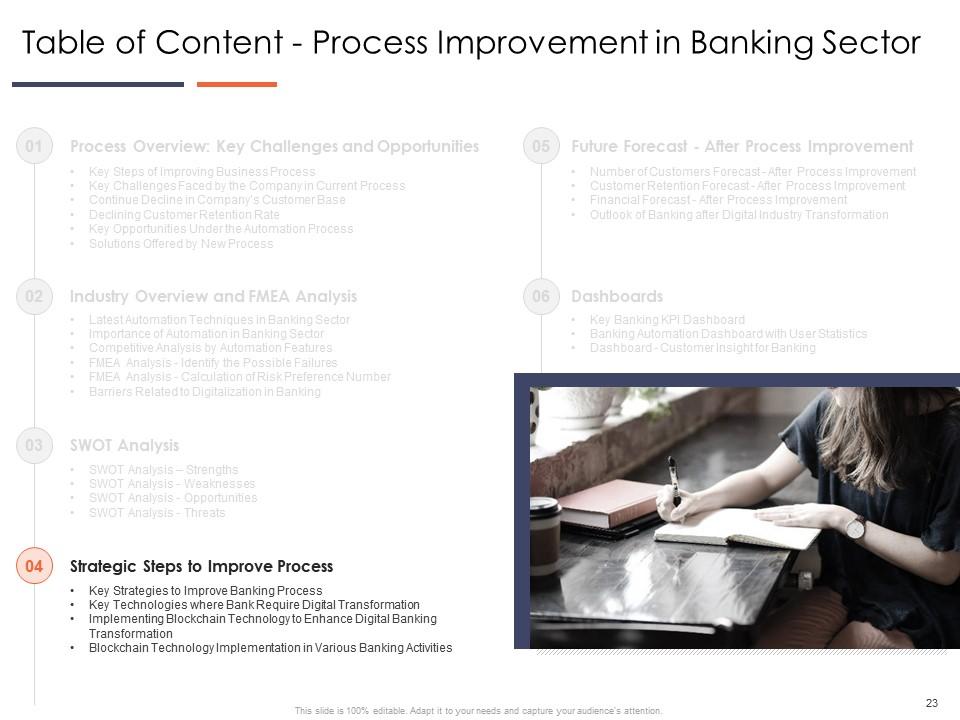
Slide 23: This slide is titled “Table of Content - Process Improvement in Banking Sector.” It includes the Strategic Steps to Improve Processes.
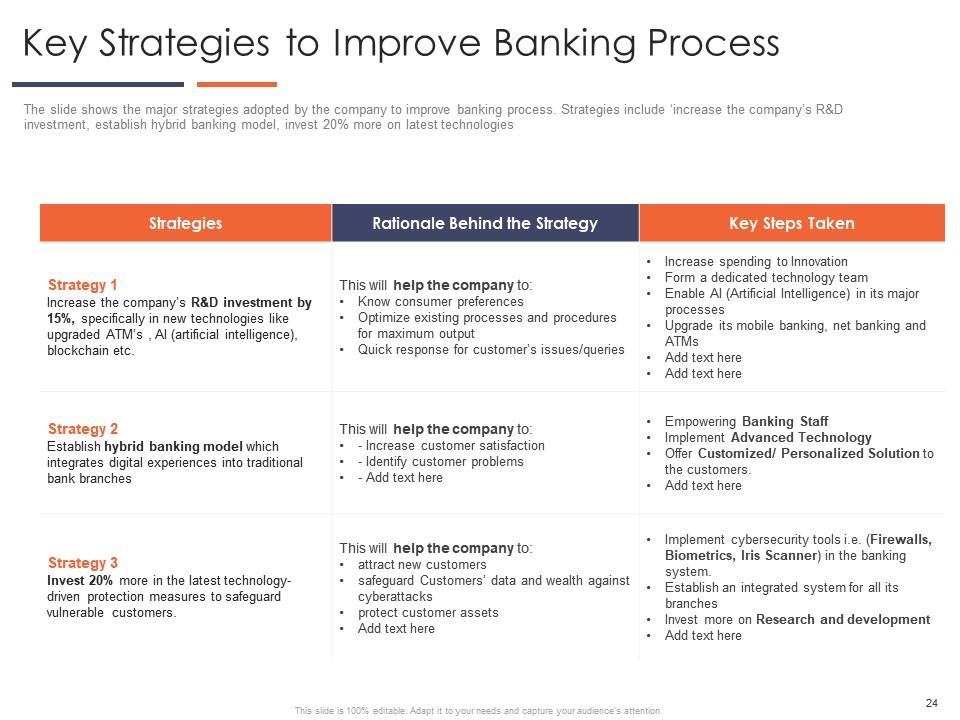
Slide 24: This slide is titled “Key Strategies to Improve Banking Process.” It shows the major strategies adopted by the company to improve the banking process. Strategies include increasing the company’s R&D investment, establishing a hybrid banking model, and investing 20% more on the latest technologies.
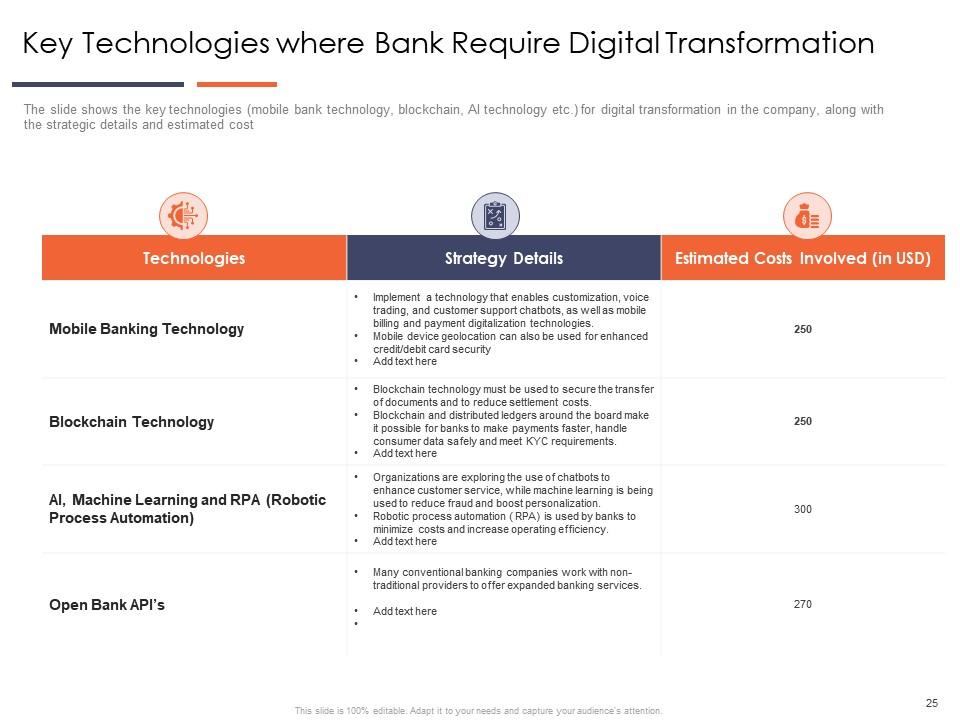
Slide 25: This slide is titled “Key Technologies where Banks Require Digital Transformation.” It shows the key technologies (mobile bank technology, blockchain, AI technology, etc.) for digital transformation in the company, along with the strategic details, and estimated cost.
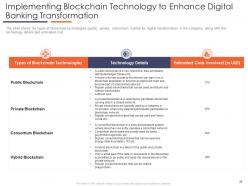
Slide 26: This slide is titled “Implementing Blockchain Technology to Enhance Digital Banking Transformation.” It shows the types of blockchain technologies (public, private, consortium, hybrid) for digital transformation in the company, along with the technical details and estimated cost.
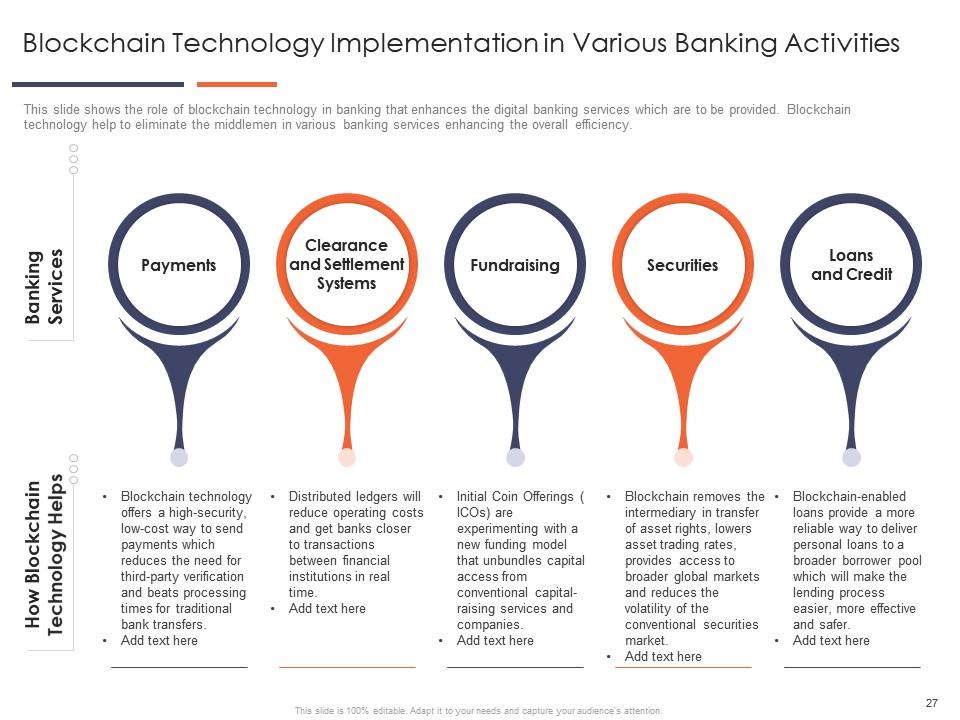
Slide 27: This slide is titled “Blockchain Technology Implementation in Various Banking Activities.” It shows the role of blockchain technology in banking that enhances the digital banking services which are to be provided.
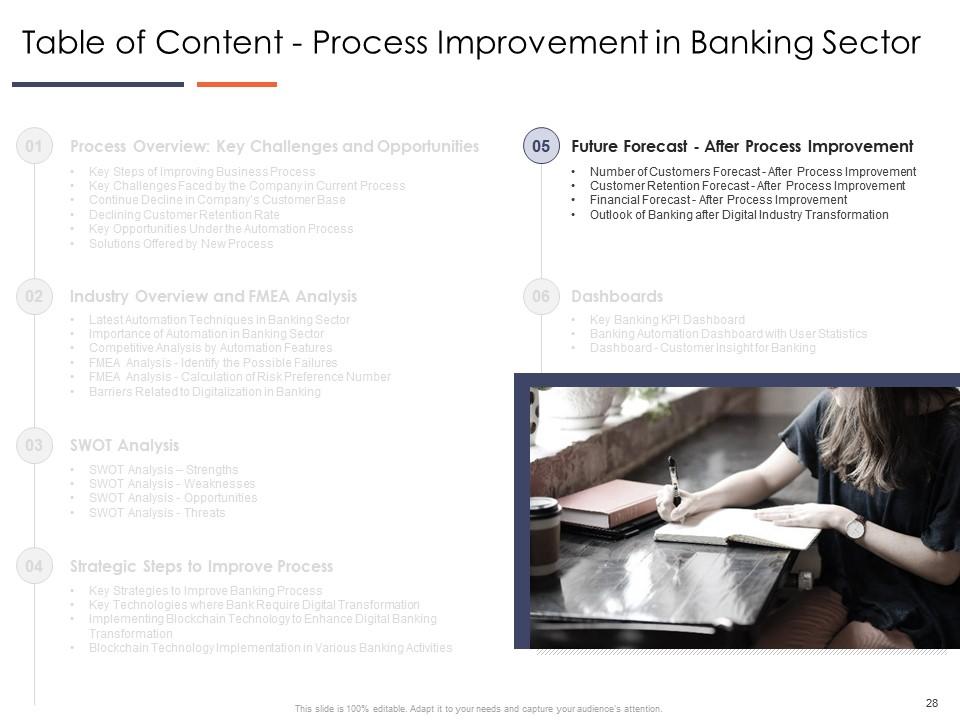
Slide 28: This slide is titled “Table of Content - Process Improvement in Banking Sector.” It shows Future Forecast - After Process Improvement.
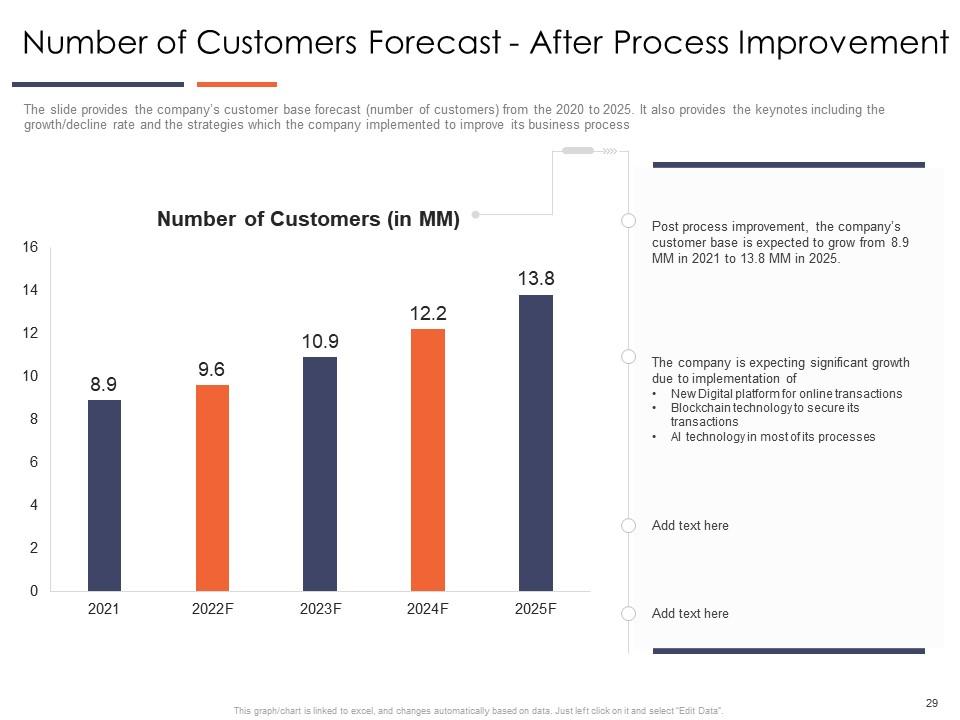
Slide 29: This slide is titled “Number of Customers Forecast - After Process Improvement.” It provides the company’s customer base forecast (number of customers) from 2021 to 2025. It also provides the keynotes including the growth/decline rate and the strategies which the company implemented to improve its business process.
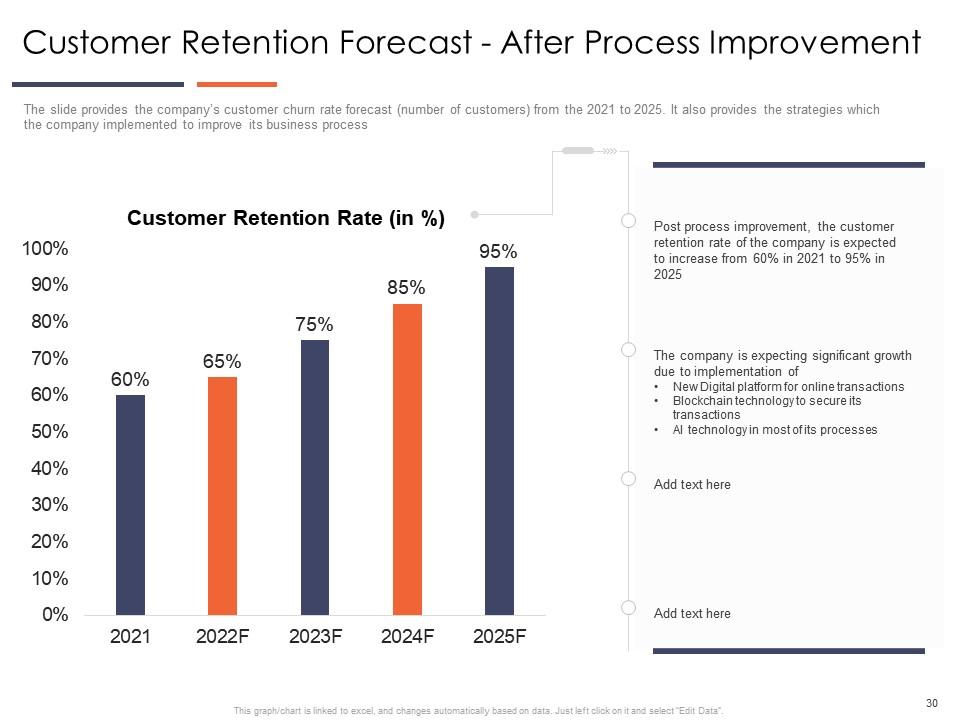
Slide 30: This slide is titled “Customer Retention Forecast - After Process Improvement.” It provides the company’s customer churn rate forecast (number of customers) from 2021 to 2025. It also provides the strategies which the company implemented to improve its business process.
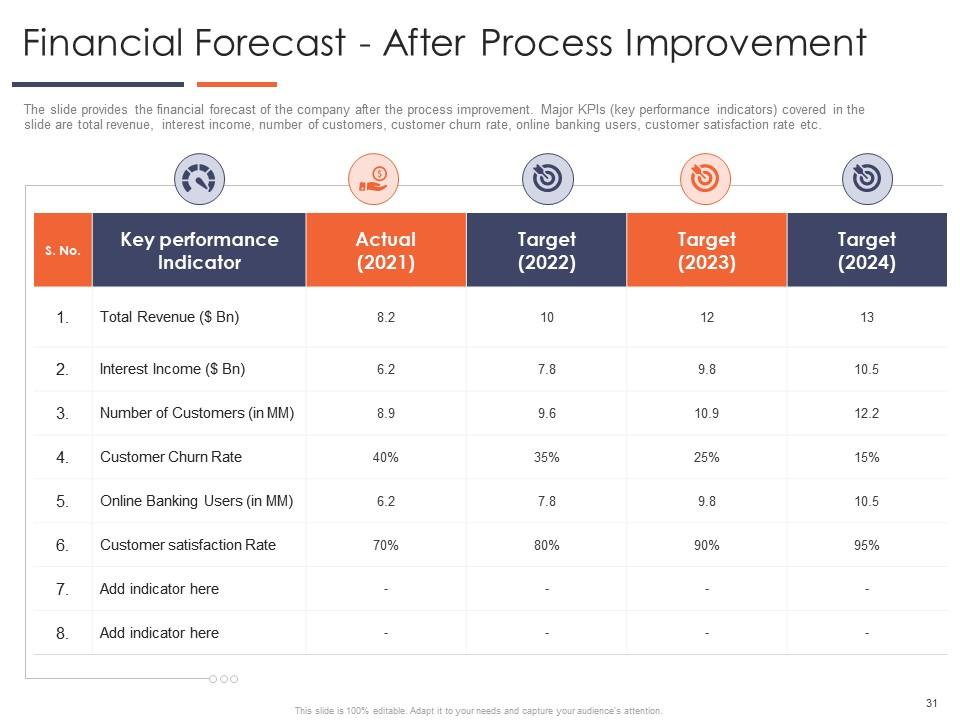
Slide 31: This slide is titled “Financial Forecast - After Process Improvement.” It provides the financial forecast of the company after the process improvement. Major KPIs (key performance indicators) covered in the slide are total revenue, interest income, number of customers, customer churn rate, etc.
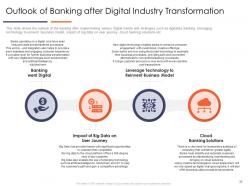
Slide 32: This slide is titled “Outlook of Banking after Digital Industry Transformation.” It shows the outlook of banking after implementing various digital trends and strategies such as digitized banking, leveraging technology to reinvent business models, cloud banking solutions, etc.
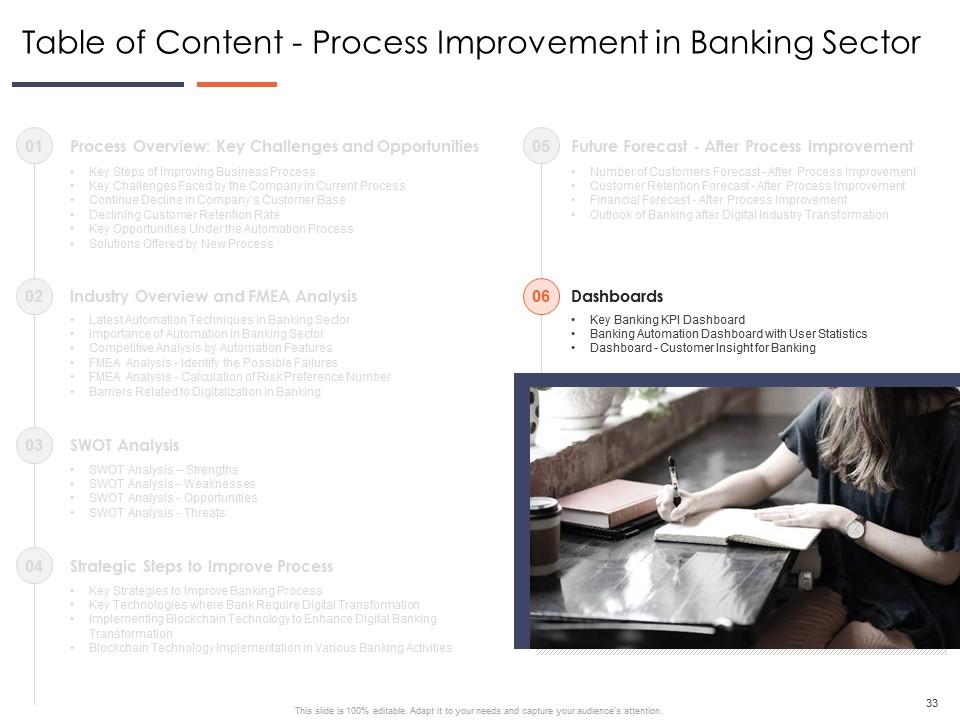
Slide 33: This slide is titled “Table of Content - Process Improvement in Banking Sector.” It includes Dashboards - Key Banking KPI Dashboard, Banking Automation Dashboard with User Statistics, and Dashboard - Customer Insight for Banking.
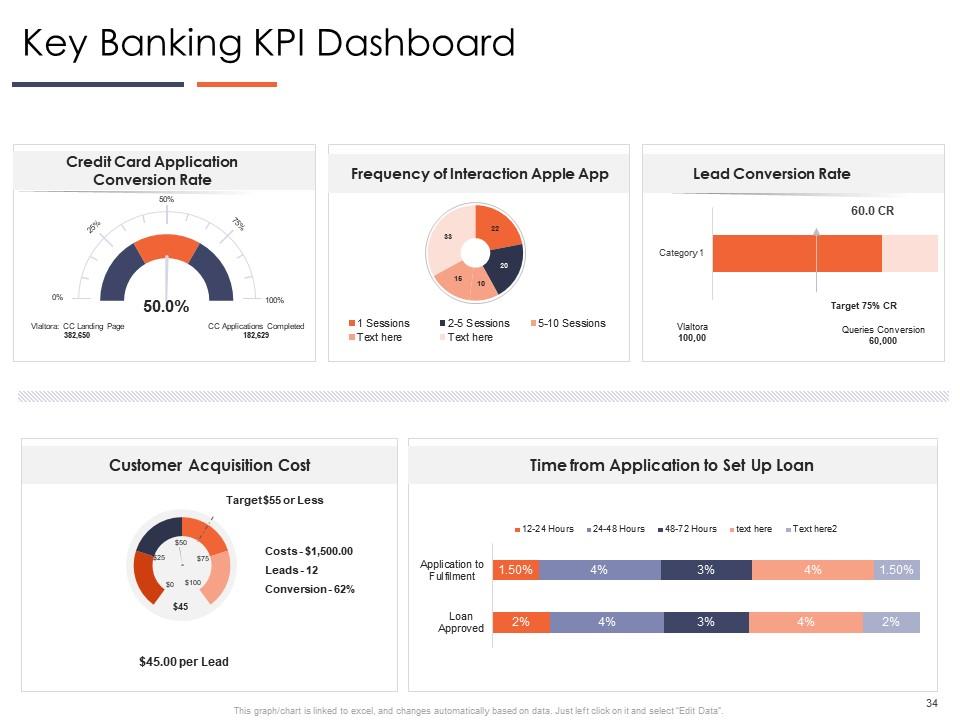
Slide 34: This slide is titled “Key Banking KPI Dashboard.” It includes Credit Card Application Conversion Rate, Frequency of Interaction Apple App, Lead Conversion Rate, etc.
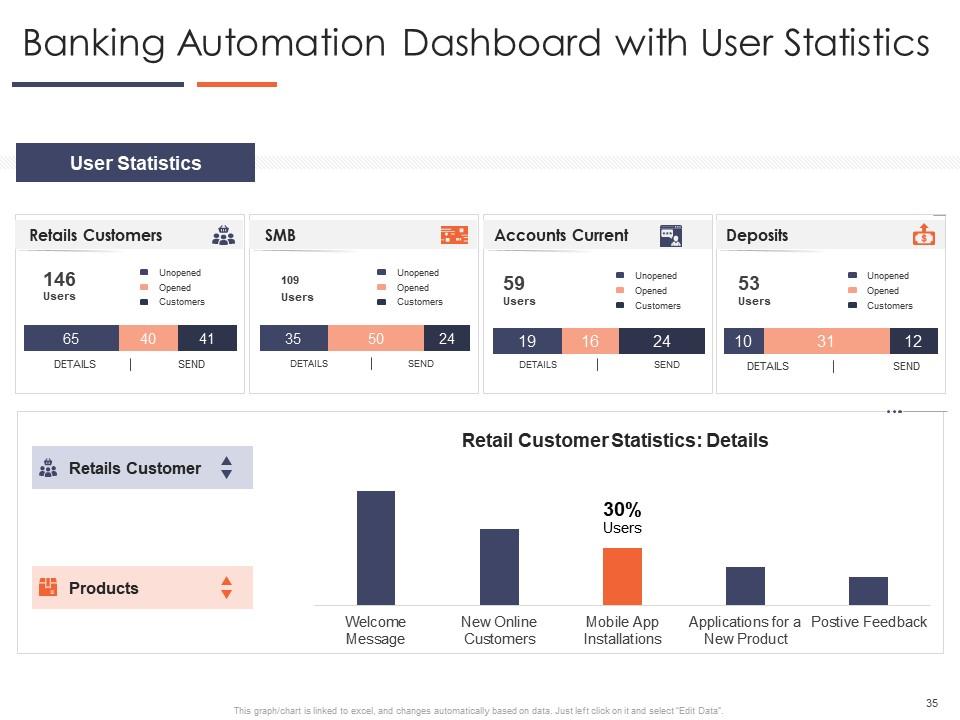
Slide 35: This slide is titled “Banking Automation Dashboard with User Statistics.” It shows User Statistics, Retails Customers, Products, Retails Customers, etc.
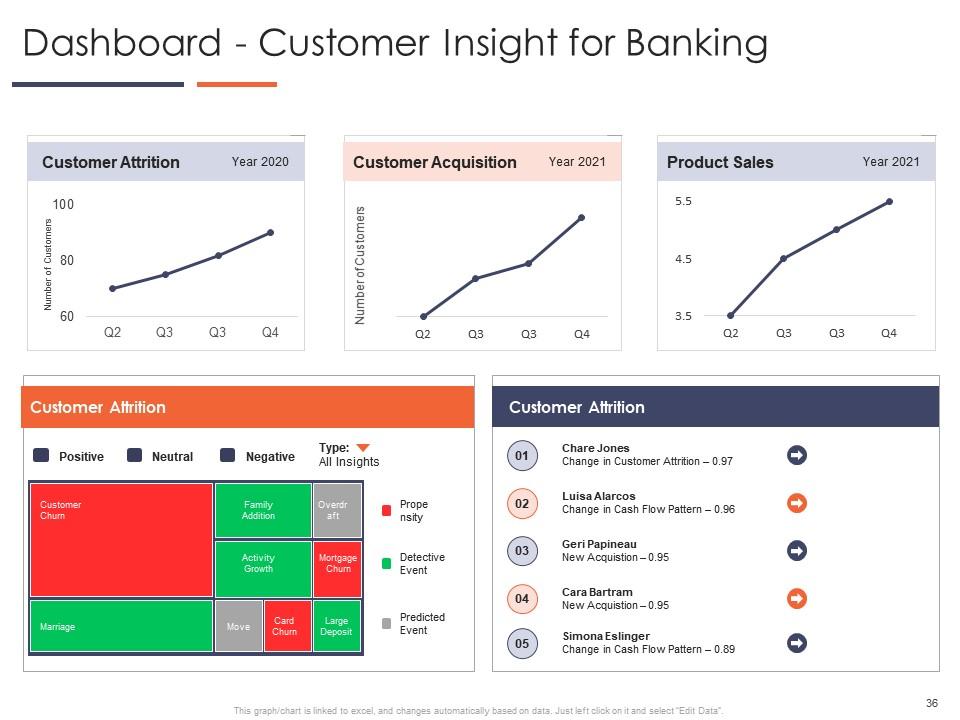
Slide 36: This slide is titled “Dashboard - Customer Insight for Banking.” It includes Customer Attrition, Customer Acquisition, Product Sales, Customer Attrition, Change in Customer, etc.
Slide 37: This slide is titled “Improve Business Efficiency by Optimizing Business Process Icons Slide.” You can use this icon slide for various use cases.
Slide 38: This slide is titled “Additional Slides.”
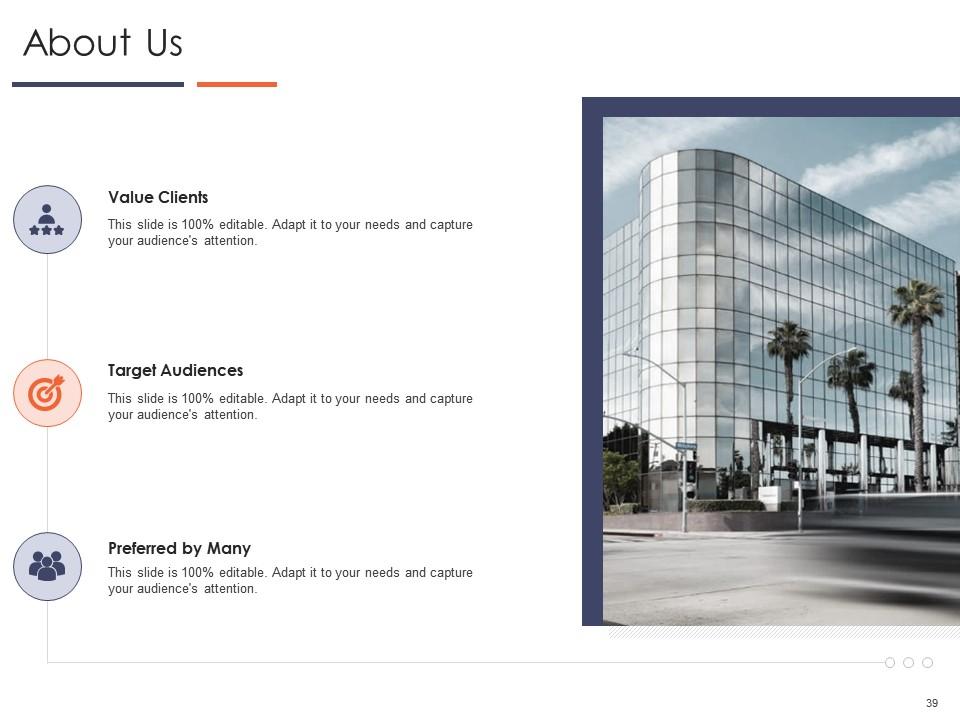
Slide 39: This slide contains the information about the company aka the ‘About Us’ section. This includes the Valued Clients, the Target Audience, and Preferred by Many.
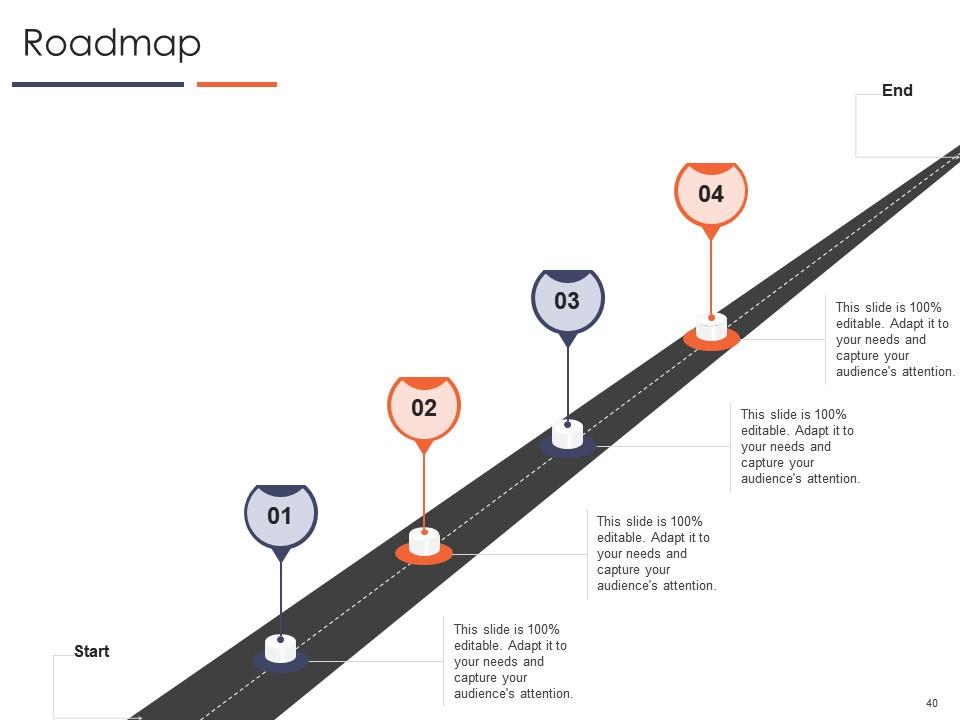
Slide 40: This slide is a Roadmap template to showcase the stages of a project. Add your product strategy here.
Slide 41: This slide is a Timeline template to showcase the progress of the steps of a project with time.
Slide 42: This slide presents a Magnifying Glass to give more details about the individual steps in a project.
Slide 43: This slide is titled “Important Notes.” You can use this template to add ideas for your product.
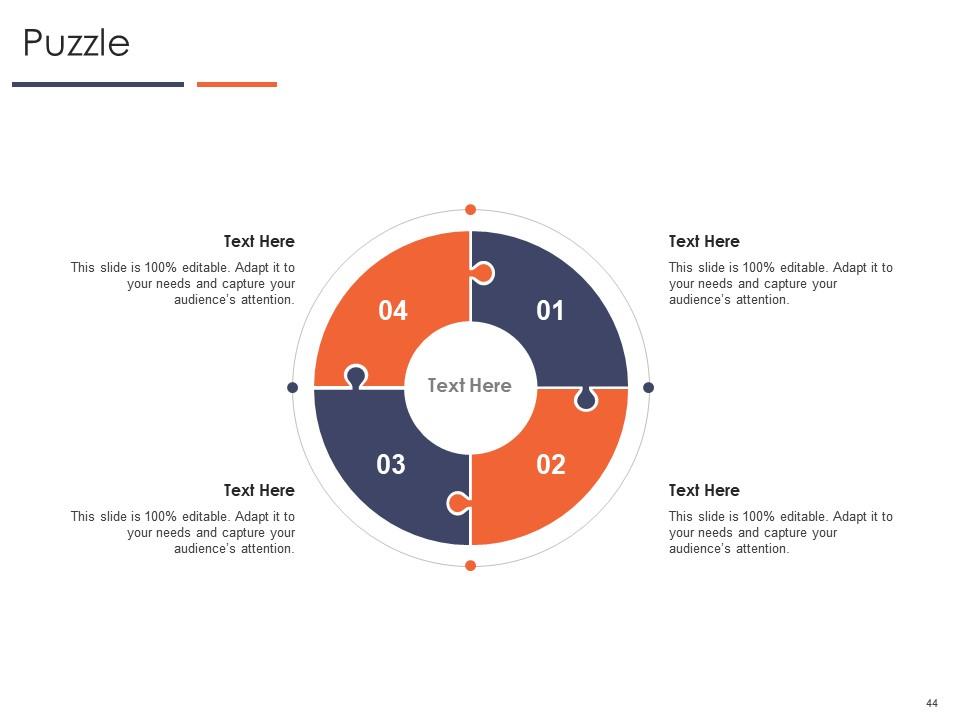
Slide 44: This slide is titled “Puzzle.” You can use this template to display your product or an idea implementation technique.
Slide 45: This slide is the Idea Generation slide. It is used to brainstorm ideas for a project.
Slide 46: This is a Thank You slide where details such as the address, contact number, and email address are added.
Improve business efficiency by optimizing business process powerpoint presentation slides with all 46 slides:
Use our Improve Business Efficiency By Optimizing Business Process Powerpoint Presentation Slides to effectively help you save your valuable time. They are readymade to fit into any presentation structure.
-
Appreciate the research and its presentable format.
-
Helpful product design for delivering presentation.
-
Use of icon with content is very relateable, informative and appealing.
-
Great quality product.
-
Professional and unique presentations.


