Improve the financial and operational performance of a railway company case competition complete deck
Display an informative set of data with our improve the financial and operational performance of a railway company case competition complete PPT deck. It is essential for the working-class to be well versed with the current situations in order to function smoothly, therefore, this upgrade the monitoring act PowerPoint layout has it at an easy access. Analyzing the company’s overview on the basis of operational and financial business information, this creative PPT set also statistically presents the other significant KPIs. This PowerPoint bundle showcases the data regarding strategy implementation, forecast- post strategy implementation and dashboards. The helpful slides in this improvement in economic conduct creative PPT set jots down all the persisting or possible problems that might occur in the business, along with corrective and systematic measures and plans for each and every issue that will help the organization to grow. Install it right now to ensure hassle free working.
- Google Slides is a new FREE Presentation software from Google.
- All our content is 100% compatible with Google Slides.
- Just download our designs, and upload them to Google Slides and they will work automatically.
- Amaze your audience with SlideTeam and Google Slides.
-
Want Changes to This PPT Slide? Check out our Presentation Design Services
- WideScreen Aspect ratio is becoming a very popular format. When you download this product, the downloaded ZIP will contain this product in both standard and widescreen format.
-

- Some older products that we have may only be in standard format, but they can easily be converted to widescreen.
- To do this, please open the SlideTeam product in Powerpoint, and go to
- Design ( On the top bar) -> Page Setup -> and select "On-screen Show (16:9)” in the drop down for "Slides Sized for".
- The slide or theme will change to widescreen, and all graphics will adjust automatically. You can similarly convert our content to any other desired screen aspect ratio.
Compatible With Google Slides

Get This In WideScreen
You must be logged in to download this presentation.
PowerPoint presentation slides
Presenting our improve the financial and operational performance of a railway company case competition complete PPT deck. This PowerPoint theme includes fifty slides and each one of them is available for download in both standard and widescreen formats. Easy to edit, this PPT deck is compatible with all popular presentation software such as Microsoft Office, Google Slides, and many others.
People who downloaded this PowerPoint presentation also viewed the following :
Content of this Powerpoint Presentation
Slide 1: This slide introduces Improve The Financial And Operational Performance Of A Railway Company. State Your Company Name and begin.
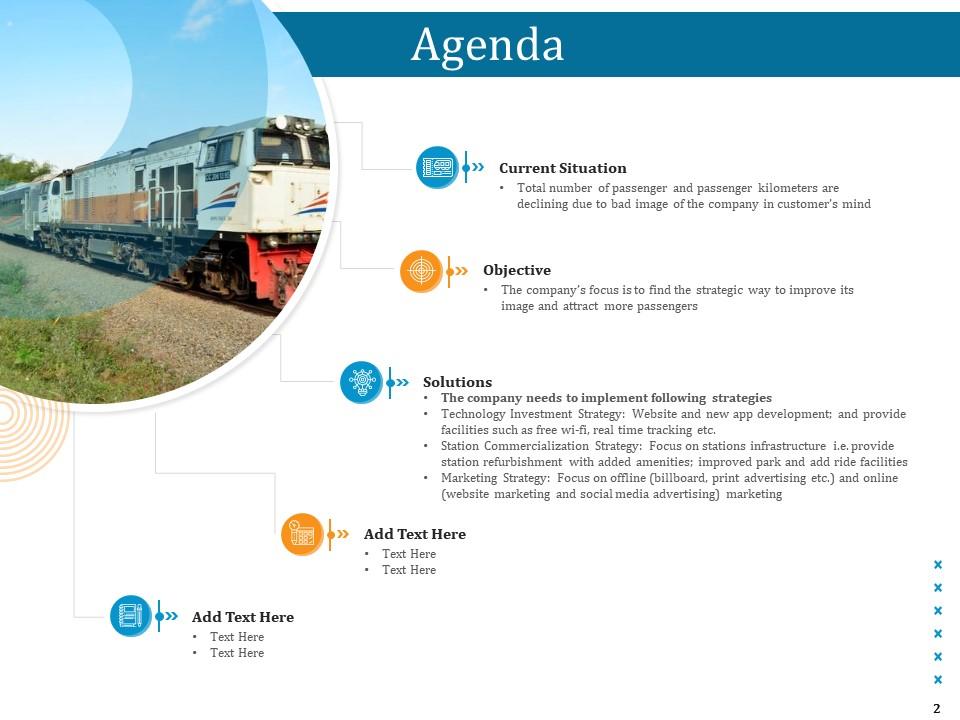
Slide 2: This is an Agenda slide. State your agendas here.
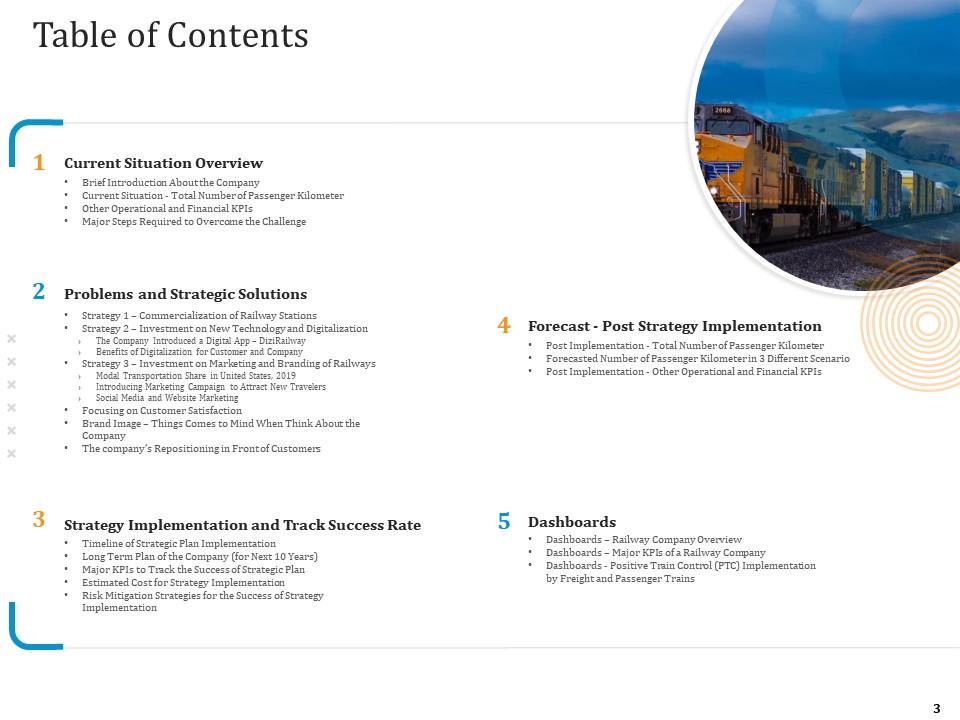
Slide 3: This slide shows Table of Content for the presentation.
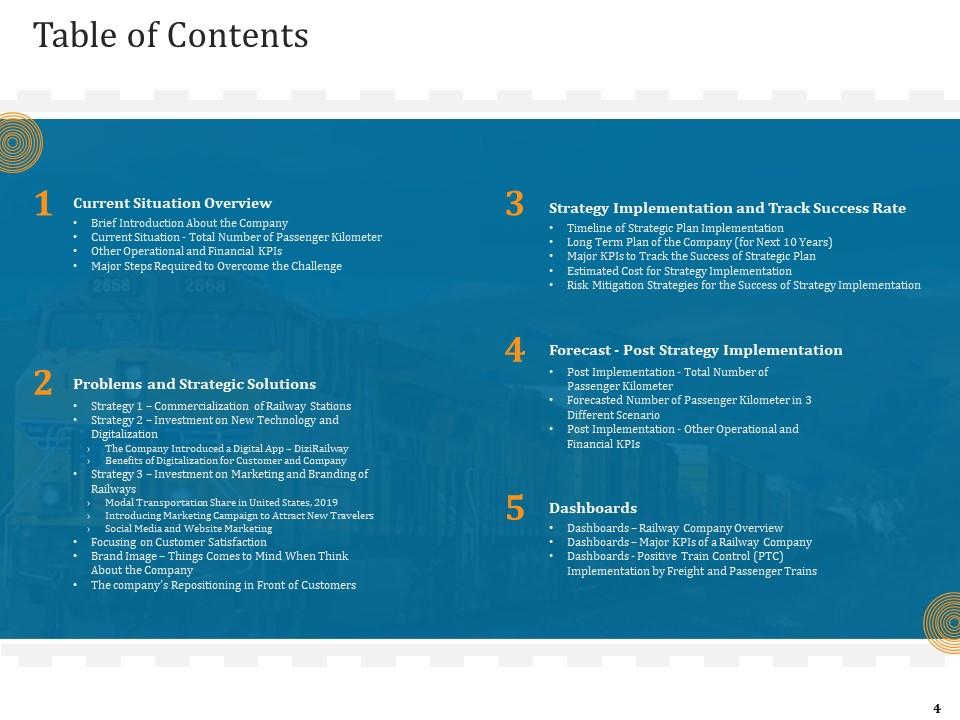
Slide 4: This slide presents Table of Content for the presentation.
Slide 5: This slide shows Table of Content highlighting Current Situation Overview.
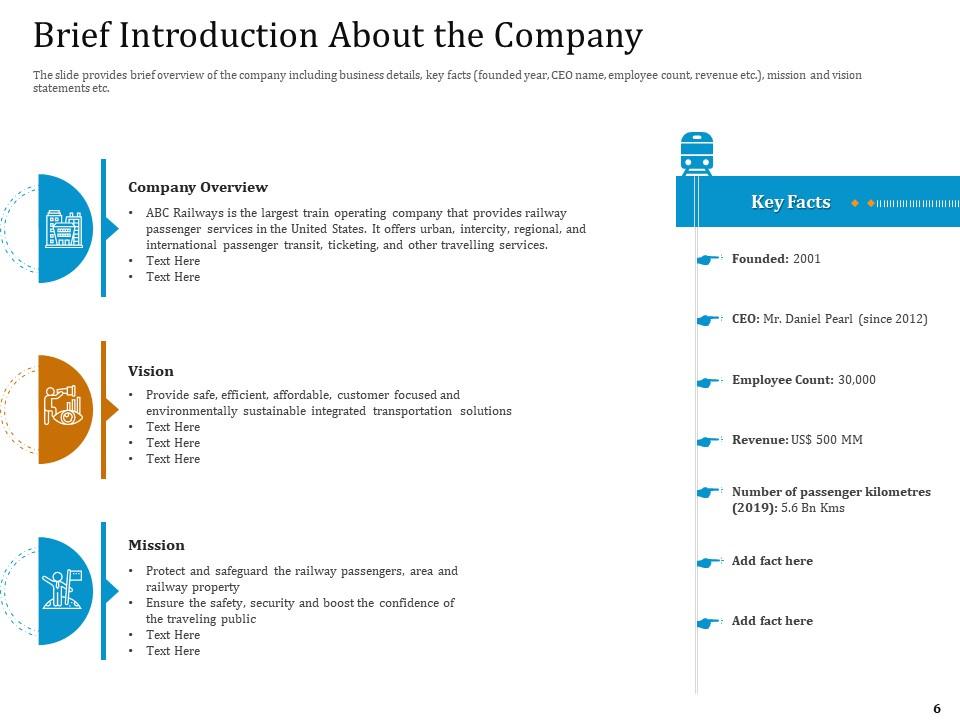
Slide 6: This slide displays brief overview of the company including business details, key facts (founded year, CEO name, etc.
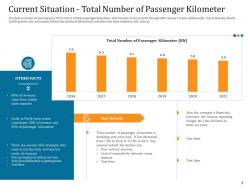
Slide 7: This slide represents Current Situation - Total Number of Passenger Kilometer.
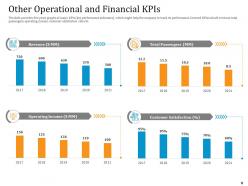
Slide 8: The slide provides five years graphs of major KPIs which might help the company to track its performance.
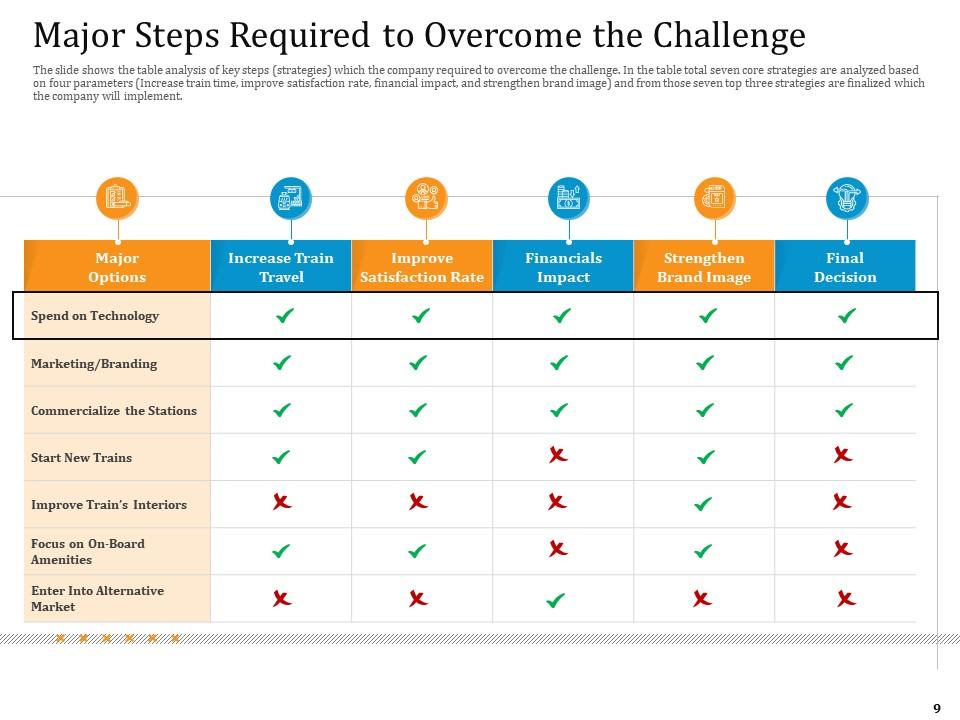
Slide 9: This slide presents Major Steps Required to Overcome the Challenge.
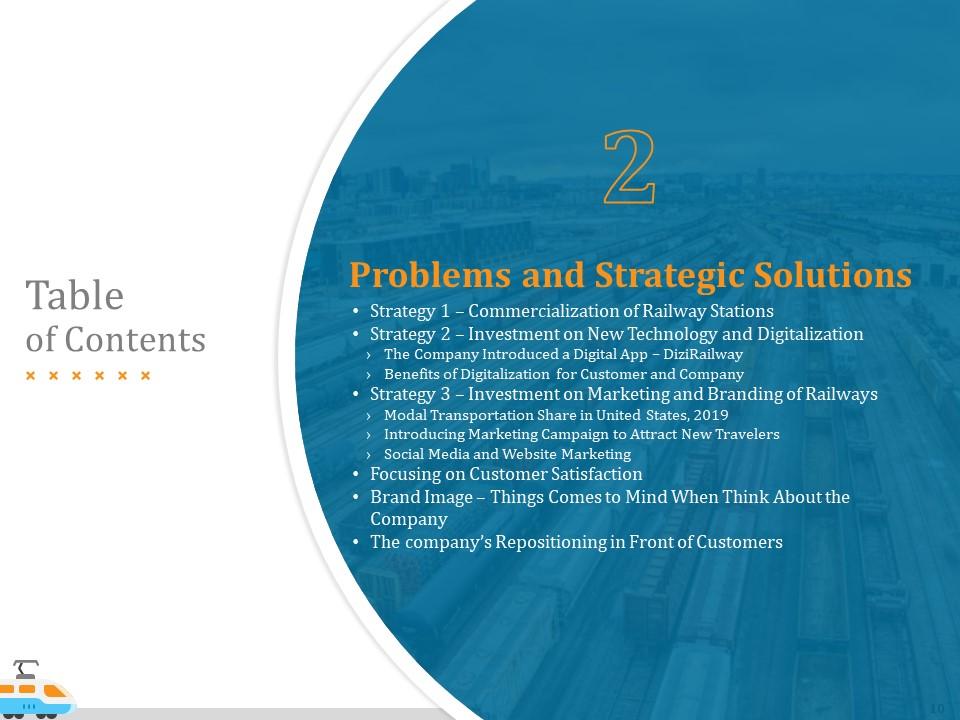
Slide 10: This slide shows Table of Content for the presentation.
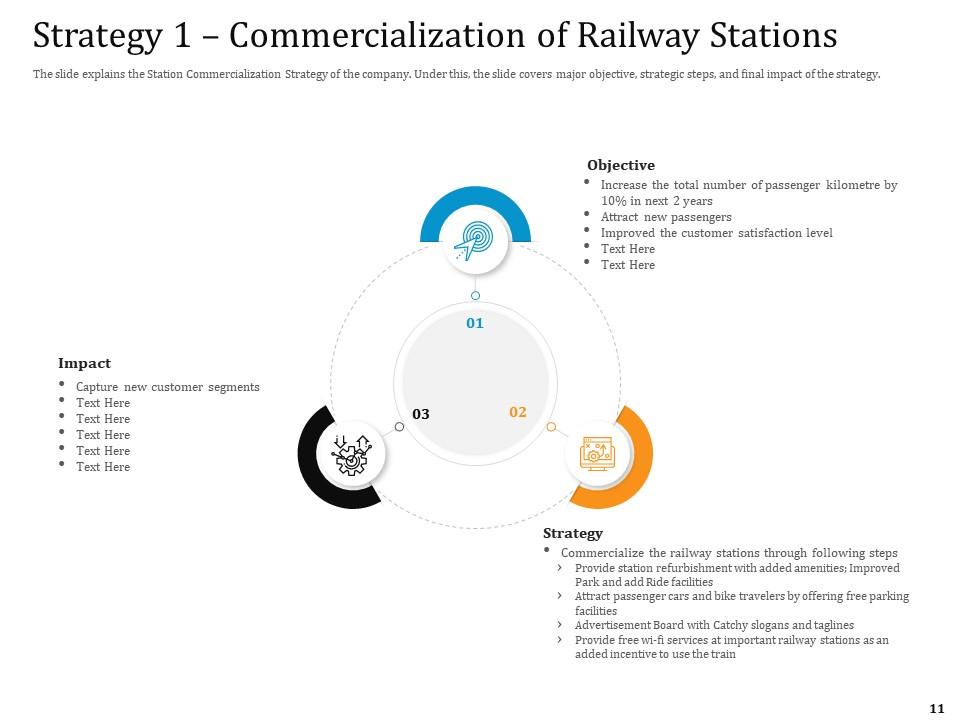
Slide 11: The slide displays the Station Commercialization Strategy of the company.
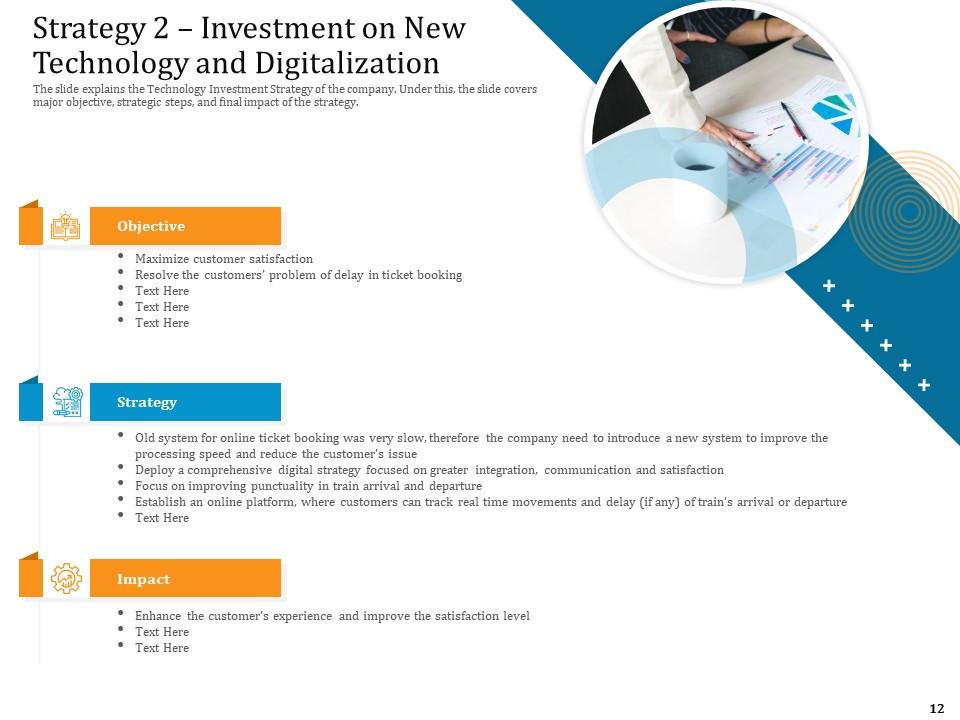
Slide 12: The slide represents the Technology Investment Strategy of the company.
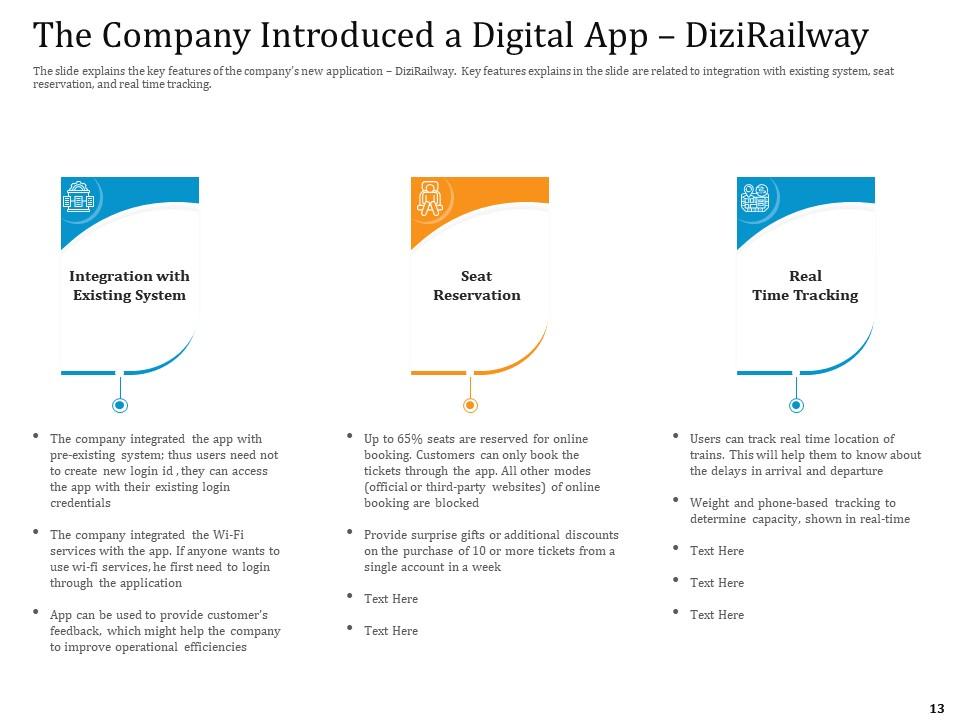
Slide 13: The slide explains the key features of the company’s new application.
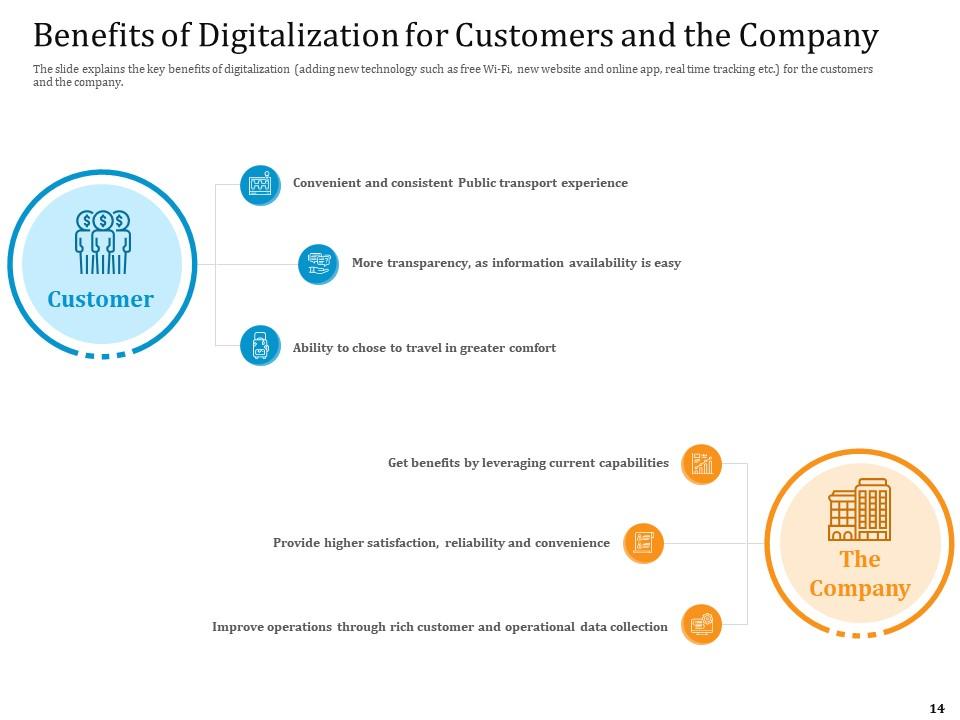
Slide 14: This slide presents Benefits of Digitalization for Customers and the Company.
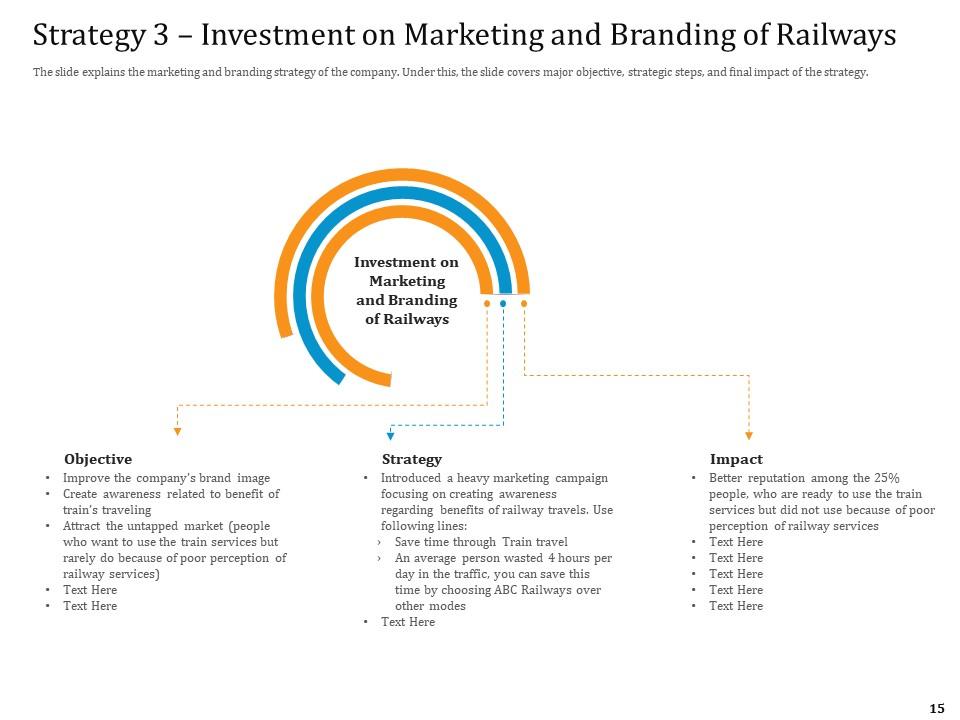
Slide 15: The slide explains the marketing and branding strategy of the company.
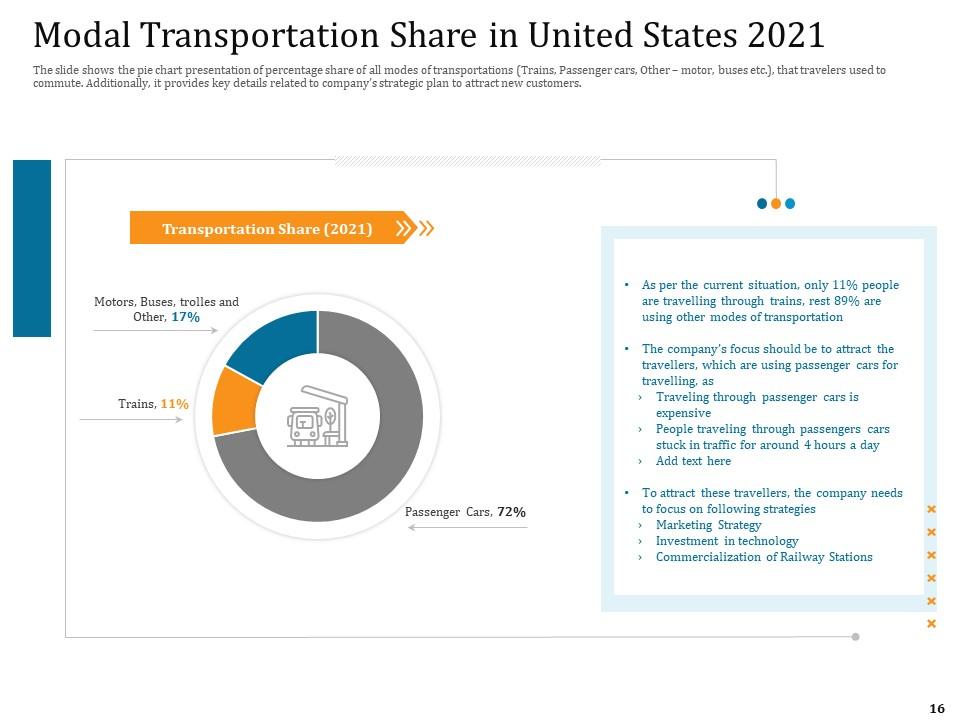
Slide 16: The slide displays the pie chart presentation of percentage share of all modes of transportations.
Slide 17: The slide represents the new marketing campaign, which the company has introduced to attract new customers.
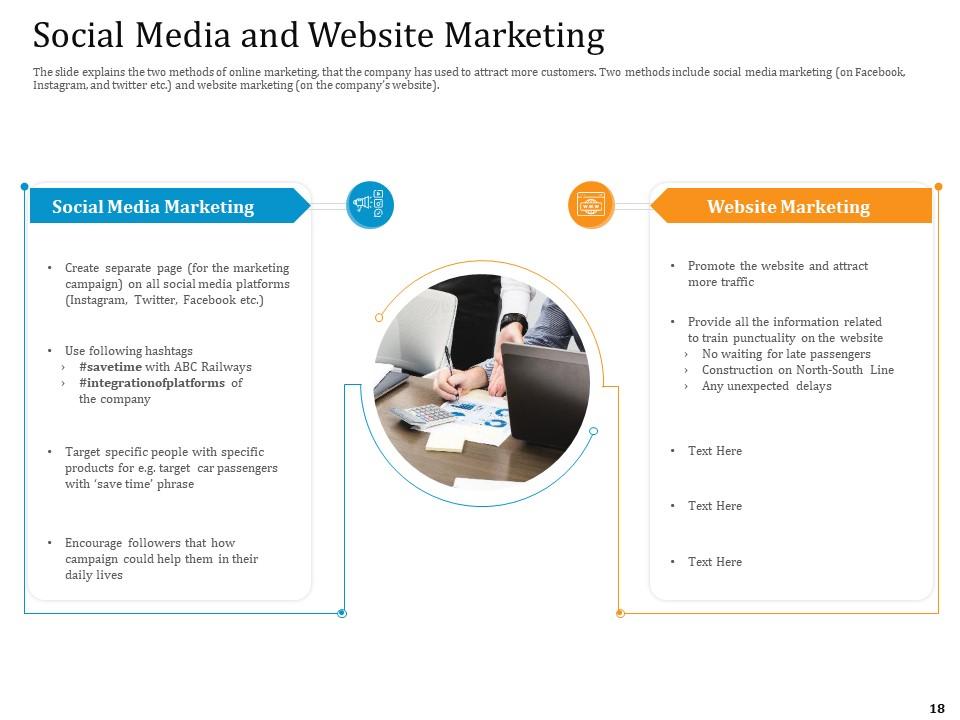
Slide 18: The slide explains the two methods of online marketing, that the company has used to attract more customers.
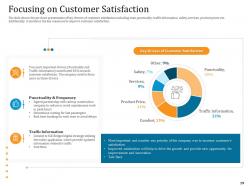
Slide 19: The slide presents the pie chart presentation of key drivers of customer satisfaction.
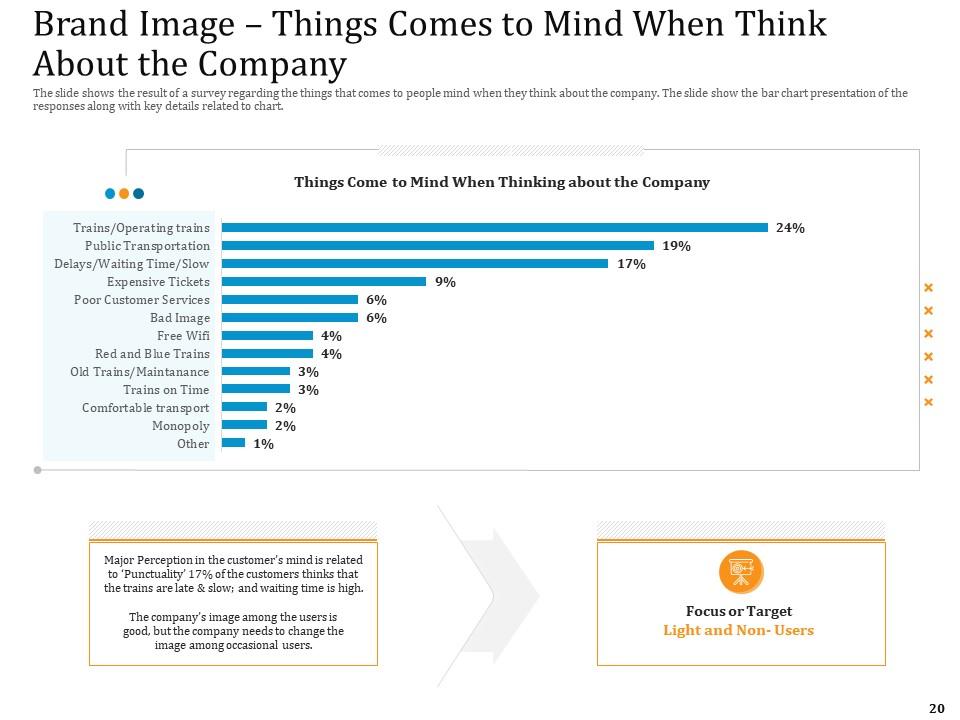
Slide 20: The slide shows the result of a survey regarding the things that comes to people mind when they think about the company.
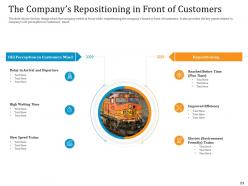
Slide 21: The slide displays the key things which the company needs to focus while repositioning the company’s brand in front of customers.
Slide 22: This slide represents Table of Content for the presentation.
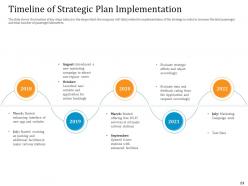
Slide 23: The slide shows the timeline of key steps taken related to implementation of the strategy in order to increase the total passenger and total number of passenger kilometres.
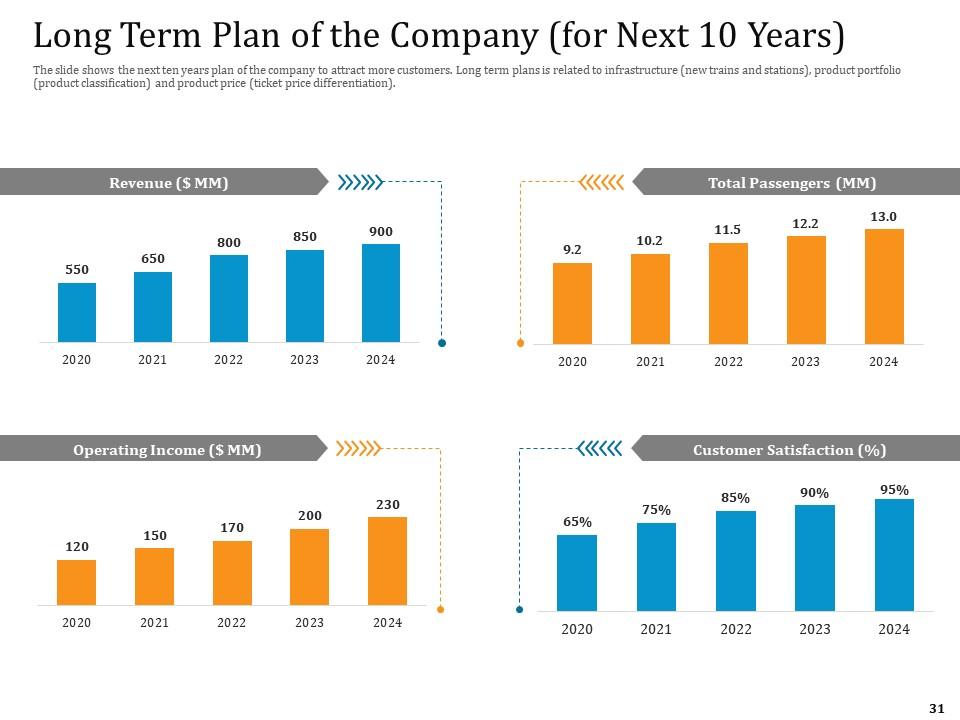
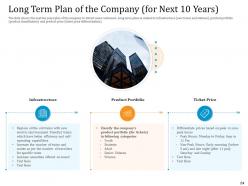
Slide 24: The slide presents the next ten years plan of the company to attract more customers.
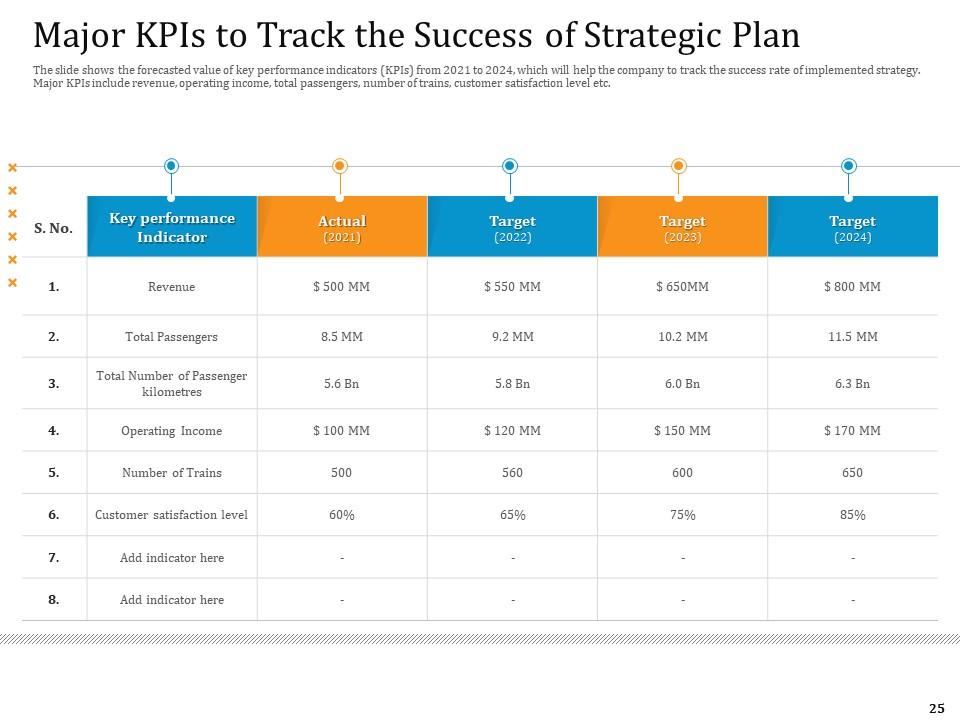
Slide 25: The slide shows the forecasted value of key performance indicators (KPIs) from 2021 to 2024.
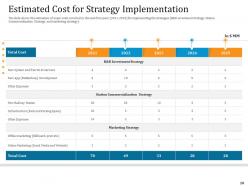
Slide 26: The slide displays the estimation of major costs involved in the next five years for implementing the strategies.
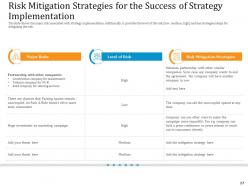
Slide 27: This slide represents Risk Mitigation Strategies for the Success of Strategy Implementation.
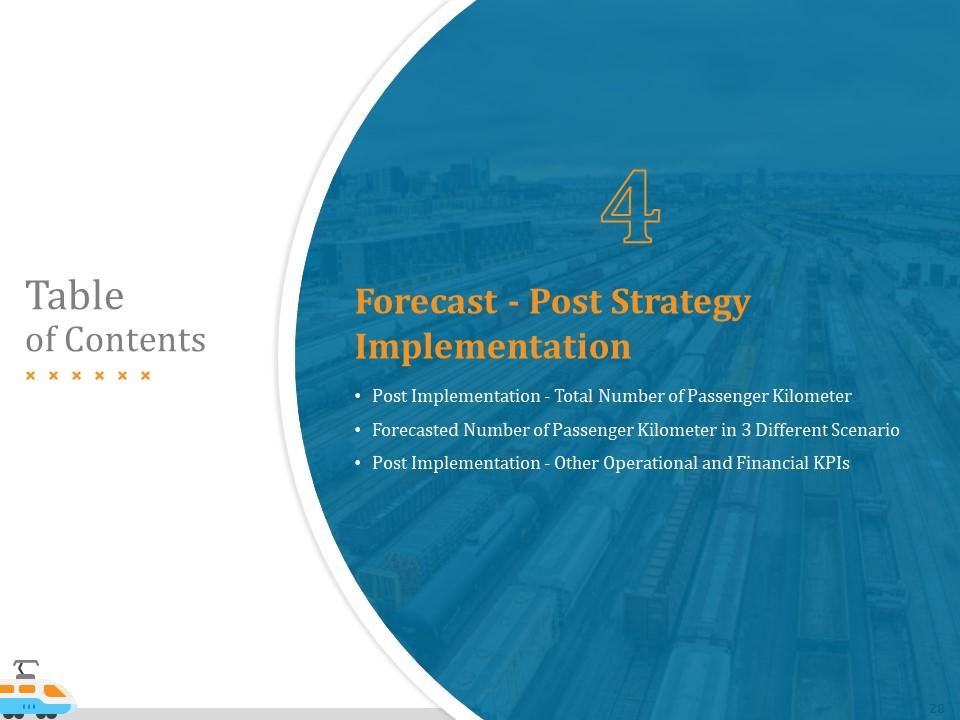
Slide 28: This slide shows Table of Content for the presentation.
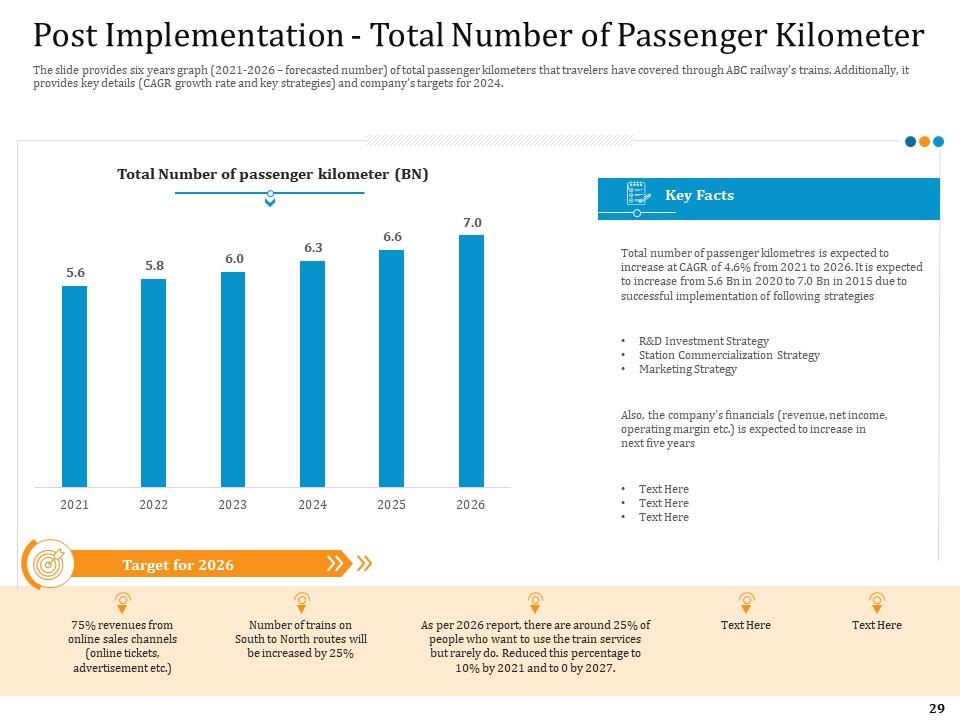
Slide 29: The slide presents six years graph of total passenger kilometers that travelers have covered through ABC railway’s trains.
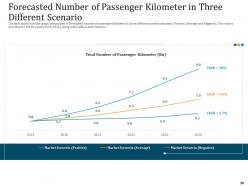
Slide 30: This slide shows Forecasted Number of Passenger Kilometer in Three Different Scenario.
Slide 31: This slide displays Long Term Plan of the Company (for Next 10 Years).
Slide 32: This slide represents Table of Content for the presentation.
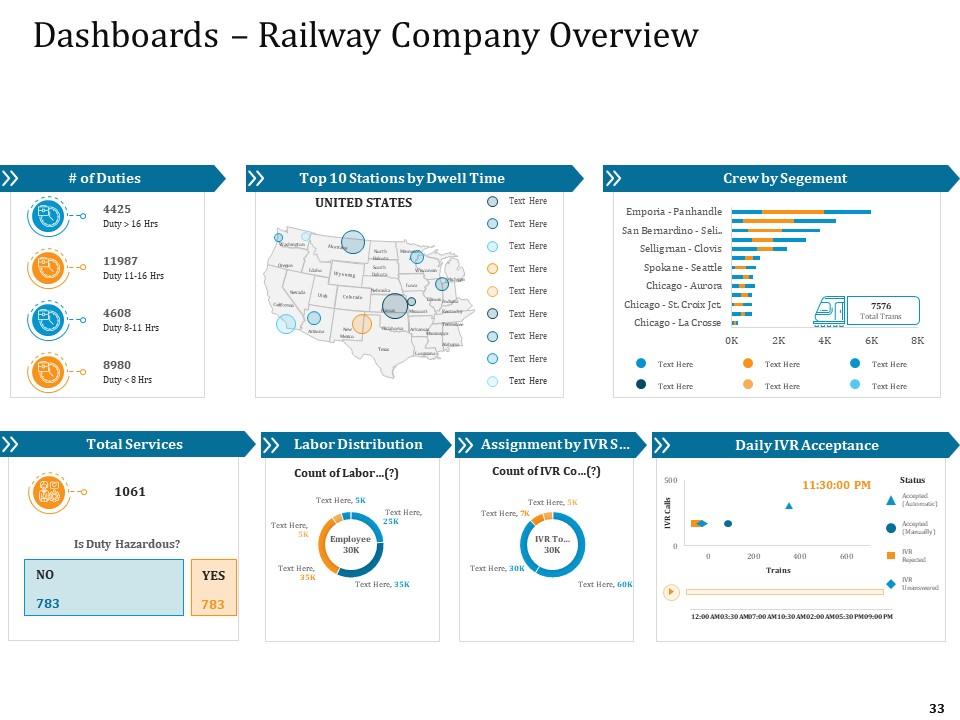
Slide 33: This slide shows Dashboards – Railway Company Overview.
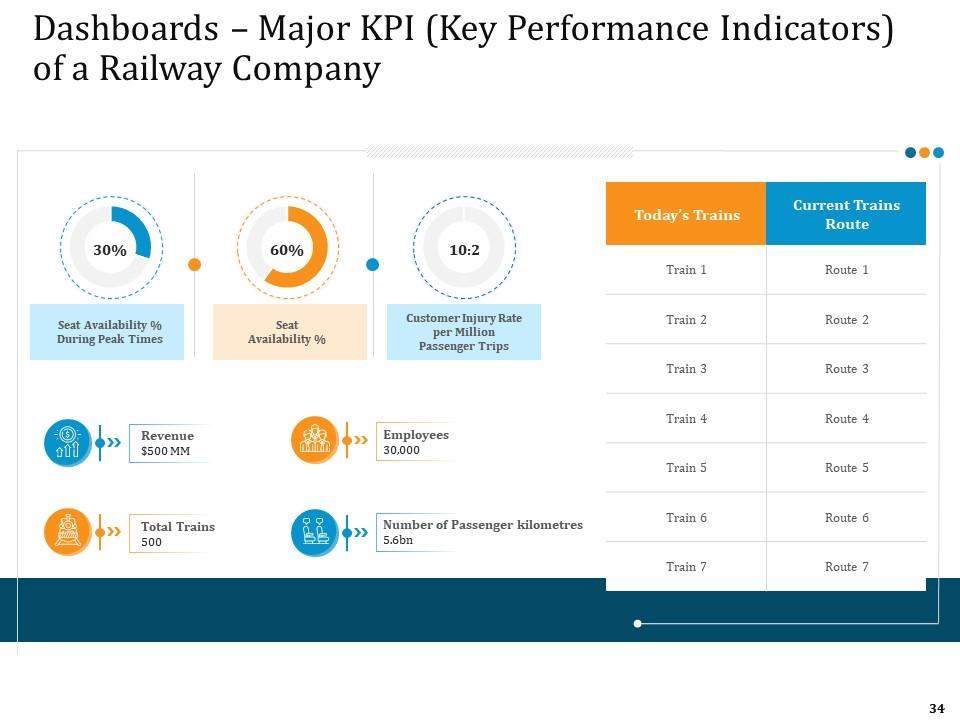
Slide 34: This slide presents Dashboards – Major KPI (Key Performance Indicators) of a Railway Company.
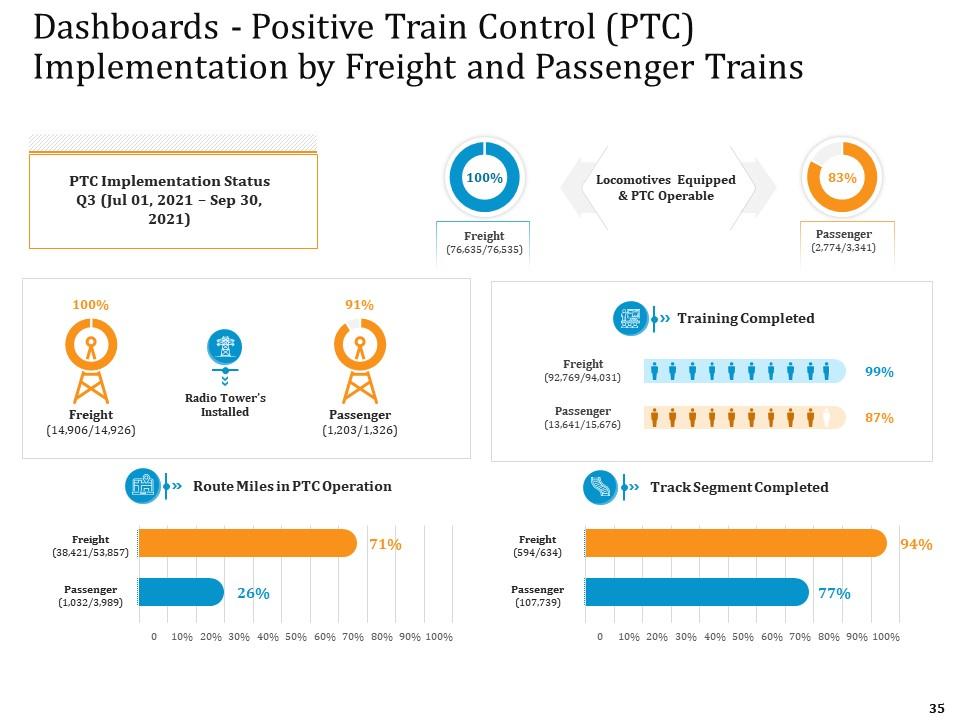
Slide 35: This slide shows Dashboards - Positive Train Control (PTC) Implementation by Freight and Passenger Trains.
Slide 36: This slide displays Improve the Financial and Operational Performance of a Railway Company (Case Competition) Icons.
Slide 37: This slide is titled as Additional Slides for moving forward.
Slide 38: This is About Us slide to show company specifications etc.
Slide 39: This is Our Mission slide with related imagery and text.
Slide 40: This is Our Team slide with names and designation.
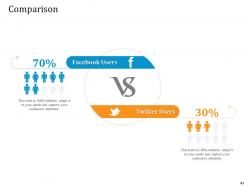
Slide 41: This is a Comparison slide to state comparison between commodities, entities etc.
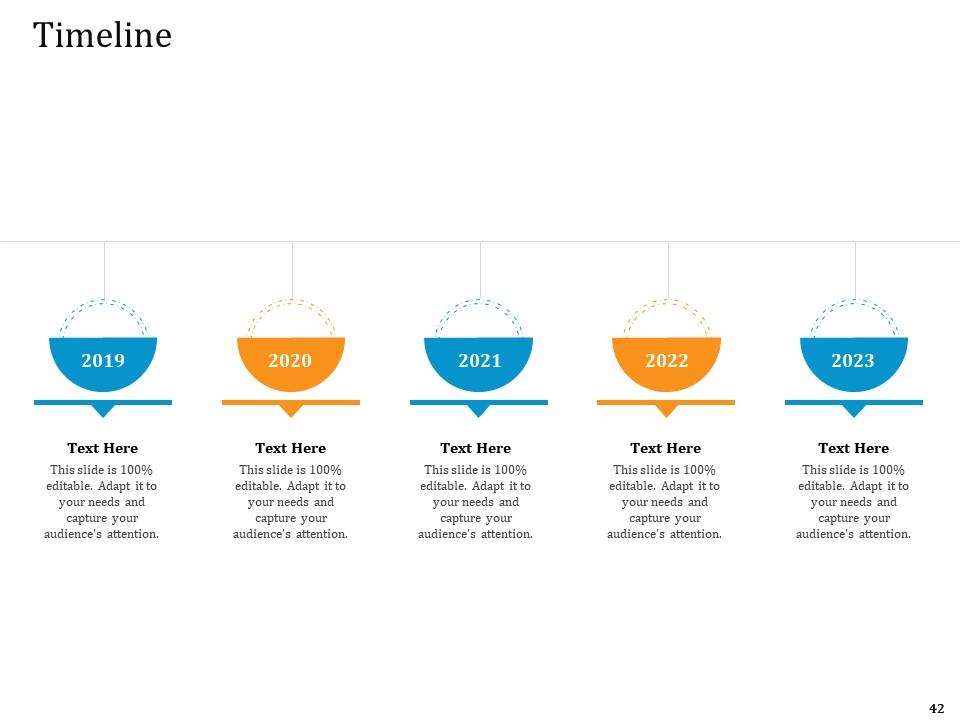
Slide 42: This is a Timeline slide. Show data related to time intervals here.
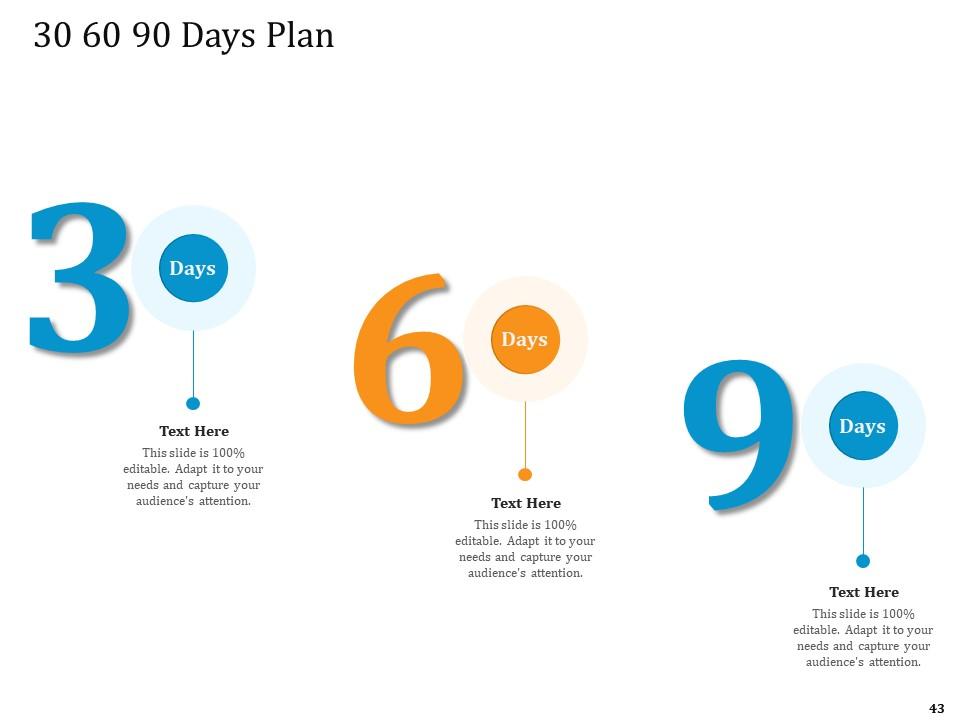
Slide 43: This slide shows 30 60 90 Days Plan with text boxes.
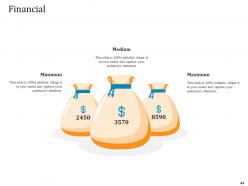
Slide 44: This is a Financial slide. Show your finance related stuff here.
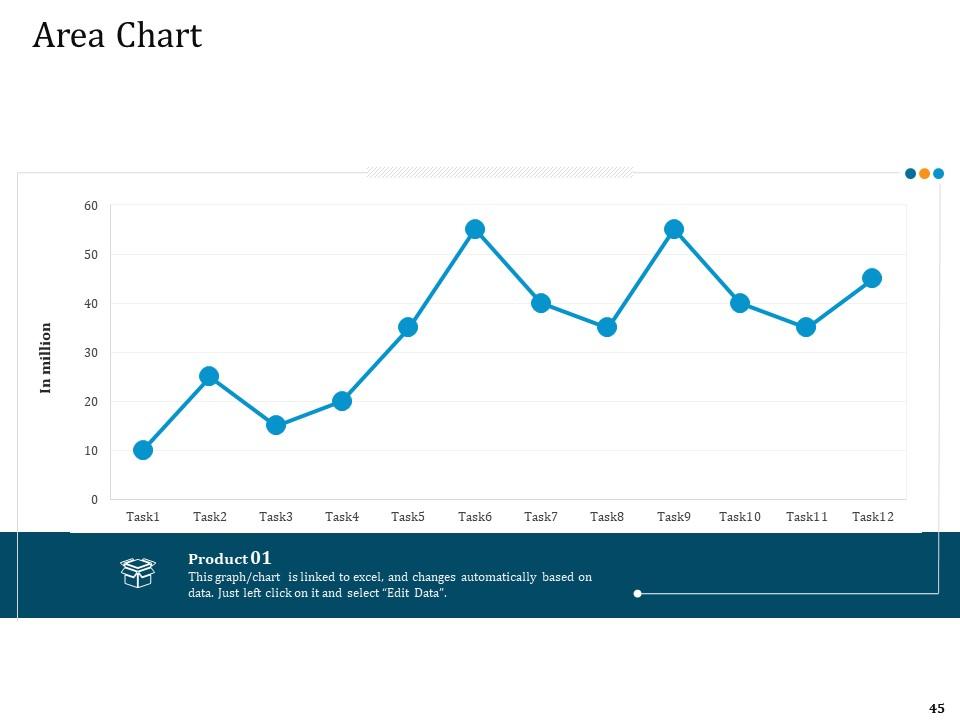
Slide 45: This slide displays Area chart with two products comparison.
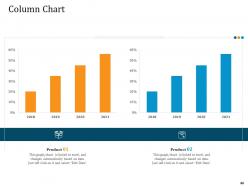
Slide 46: This slide displays Column chart with two products comparison.
Slide 47: This slide represents Post It Notes. Post your important notes here.
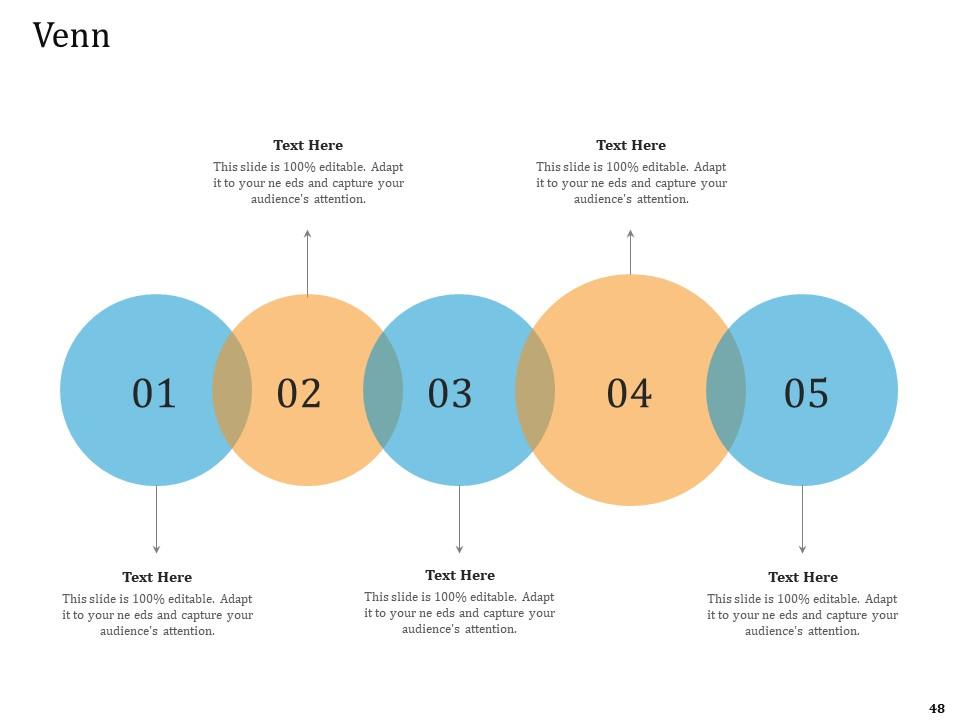
Slide 48: This slide shows Venn diagram with text boxes.
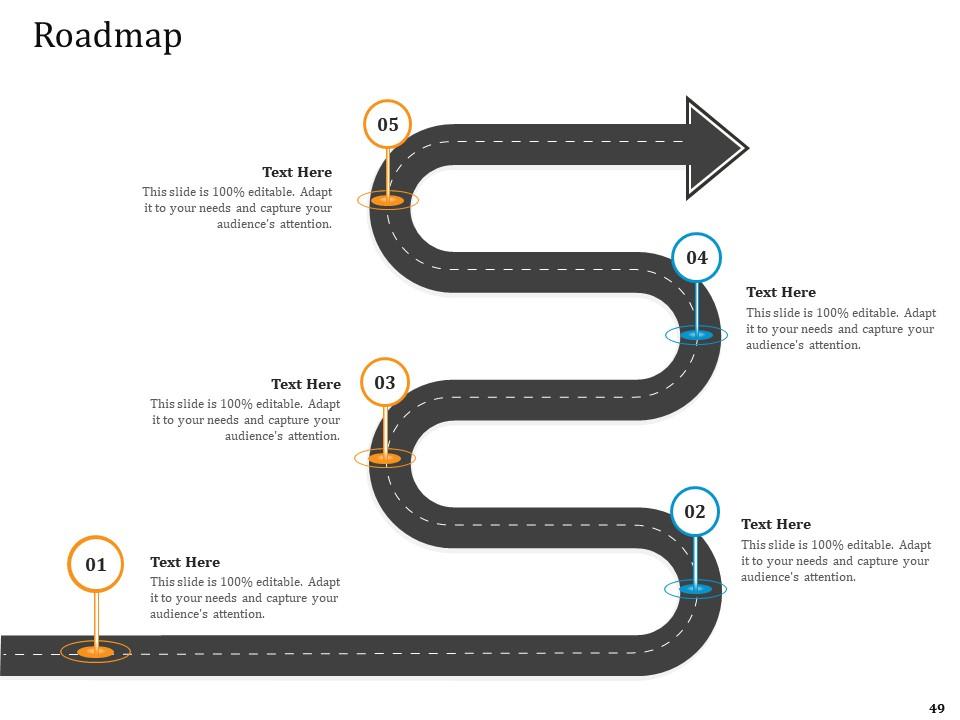
Slide 49: This slide presents Roadmap with additional textboxes.
Slide 50: This is a Thank You slide with address, contact numbers and email address.
Improve the financial and operational performance of a railway company case competition complete deck with all 50 slides:
Use our Improve The Financial And Operational Performance Of A Railway Company Case Competition Complete Deck to effectively help you save your valuable time. They are readymade to fit into any presentation structure.
-
Great designs, Easily Editable.
-
Top Quality presentations that are easily editable.


