

Data analytics data search technology ppt slides





Try Before you Buy Download Free Sample Product
 Impress Your
Audience
 100%
Editable
 Save Hours
of Time


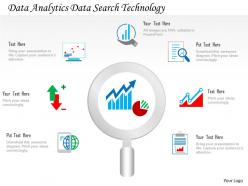
Go through our data analytics data search technology PPT template slide designed especially for your presentation requirement. Analyzing the data is as important as saving it for your future purpose. Our PowerPoint design is accessible with matching icons that you can insert in your presentation as it is or can edit it as per your business need. Studying the various commerce aspects enables you to work on the aspects where the improvement is required. The PPT diagram comes with lens in the center that completely matches with the overall design of the slide. Data analytics process is being worked by every small and large organization to take better decisions. The importance of it can be perfectly displayed with our wonderfully crafted presentation slide. So, take the first step towards the business development with our design. Also, browse through other professional presentation slides that can be beneficial for your commerce. Leave the design to us and get back to the more important things. Our compelling Data Analytics Data Search Technology Ppt Slides design do the hard work for you.
People who downloaded this PowerPoint presentation also viewed the following :
Data analytics data search technology ppt slides with all 5 slides:
Use our Data Analytics Data Search Technology Ppt Slides to effectively help you save your valuable time. They are readymade to fit into any presentation structure.


FAQs for Data analytics data search
So descriptive analytics is basically your standard reports - shows what already happened in your business. Pretty straightforward stuff. Predictive takes that same data but tries to guess what's coming next, like which customers might bail or how sales will look. Prescriptive is where it gets interesting though - that's when the system actually tells you what to do about those predictions. Uses fancy algorithms to recommend specific moves. Honestly, most companies I've seen just start with the basic reporting stuff since it's way easier to set up, then gradually work toward the predictive side once they've got their data house in order.
Honestly, you gotta nail down your baseline numbers first - like what are you actually trying to fix? Customer acquisition costs, churn rates, whatever. Then track the dollar impact after you roll everything out. The annoying thing is some benefits take forever to show up, which makes the C-suite twitchy. But if you can connect your work to real outcomes - less churn, faster decisions - the math gets pretty simple: (gains minus costs) divided by costs. Oh and definitely set up dashboards to keep tracking this stuff regularly. Executives love their pretty charts.
So machine learning basically turbocharges your data analysis - it finds patterns and makes predictions that would take you ages to figure out manually. You're not just seeing what happened anymore, but actually understanding the why behind it and what's coming next. The speed difference is insane for spotting trends and weird outliers. Plus you can crunch through massive datasets without wanting to pull your hair out. Oh, and it handles those boring repetitive tasks too. My advice? Don't go crazy at first - just pick one analysis you do all the time and see if ML can automate that part.
Tableau and Power BI are the main ones everyone talks about. Power BI's everywhere now since most companies are already drowning in Microsoft stuff anyway. Python's matplotlib and seaborn are solid if you're into coding - way more control over everything. R's ggplot2 is still amazing for stats people. Excel though? Yeah, we all pretend we don't use it but... we totally do. My advice? Just learn whatever your company already pays for first, then maybe pick up Python later if you want to get fancy with custom stuff.
Dude, start with validation rules at every data entry point - that's like your first line of defense. Set up automated profiling to catch weird stuff early. I know it sounds boring as hell, but skipping those validation steps always bites people later. You'll want governance policies so everyone's on the same page about standards. Build alerts that ping you when quality dips. Document where your data comes from too - trust me, you'll need to trace things back eventually. Oh, and don't let IT handle everything alone. Make it everyone's problem or it won't stick.
Look, consent and transparency are huge - don't bury stuff in legal jargon nobody reads. Tell people what you're actually doing with their data. Only grab what you need, then anonymize it when possible. Watch out for bias too since that screws over certain groups unfairly. Honestly, the whole "would I want my data used this way?" test works pretty well. Document your choices and definitely get someone else to check anything sketchy. Oh, and data minimization is your friend - less data means fewer headaches later.
Dude, big data is totally changing how we analyze stuff. Companies can get real-time insights on crazy amounts of information now. Like, doctors predict patient outcomes, stores adjust inventory instantly, banks catch fraud super fast - it's pretty insane actually. More data usually means better predictions than old-school analytics could give you. Machine learning loves having tons of data to work with too. But here's the thing (and I learned this the hard way) - focus on clean data first. Doesn't matter how massive your dataset is if it's full of junk, you know?
Honestly, don't just start hoarding data because it seems like the smart thing to do. Figure out what business questions you're actually trying to solve first, then work backwards. Your data has to be clean - that whole "garbage in, garbage out" thing is painfully real. Leadership buy-in is crucial since this stuff takes time and money. Oh, and get tools your team can actually handle without wanting to quit. I'd definitely start with one small pilot project though. Prove it works on something specific before you try to boil the ocean. Once you nail that first use case, then you can think bigger.
Honestly, small businesses have a huge advantage here - you can move way faster than big companies who get bogged down in meetings about meetings. Start simple with Google Analytics and just ask your customers stuff directly. I'd focus on your local area first since you actually know those people, unlike some corporate team guessing from a conference room. Don't get overwhelmed tracking everything though - pick maybe 3 metrics that actually affect your bottom line. Big companies love their fancy dashboards but half that data's useless anyway. When something's not working, you can change it next week instead of next quarter.
Definitely go with Python or R for data stuff. Python's super versatile - pandas for cleaning data, scikit-learn for machine learning, and you can even build web apps if you want later. R's amazing for stats and honestly? The visualizations look way better than Python's without much work. Oh, and learn SQL too since you'll constantly be pulling data from databases. I started with Python because it felt less intimidating than R, plus it's useful for other things beyond just analytics. Can't go wrong with either though.
Dude, biggest thing is mixing up correlation with causation - happens all the time. Also watch for cherry-picking data that just backs up what you already think. Sample sizes matter too; like, 12 data points? Come on. Don't toss outliers without figuring out why they're weird first. Check if your data actually represents who you're trying to study. Oh, and statistical significance isn't the same as practical significance - that one trips people up. Before you present anything, ask what the data ISN'T telling you. Always throw in confidence intervals or error margins.
Dude, real-time analytics is a game changer - you catch problems and opportunities as they're happening instead of weeks later when you're screwed. I can tweak pricing or inventory instantly based on what's going down right now. Honestly feels like having GPS for business decisions (and yeah, I'm that person who still gets lost without it). The trick is figuring out which metrics actually move the needle for your specific situation. Set up some dashboards that'll ping you when shit hits the fan. Oh, and start small with just one process - don't go crazy trying to track everything at once.
Honestly, leadership has to walk the walk first - actually using data, not just preaching about it. Get dashboards and easy tools so people don't have to hunt through random systems (because they won't). Train everyone on basic data stuff so they're not intimidated by numbers. When teams make good data calls, celebrate it! Oh and this is huge - people need to feel safe sharing bad news that data reveals. Nobody wants to be the messenger who gets shot, you know? I'd probably start with just one department as a test run, then copy whatever actually works from there.
Honestly, turning your data into a story is a game changer. Raw numbers just don't stick with people - but give them a narrative with a clear beginning, middle, and end? They'll actually remember it. I've watched so many good analyses get totally ignored because someone just threw spreadsheets at executives. Nobody wants that. Find your main point first, then build around it. What's the conflict or problem your data solves? Make that the heart of your story. People need context to care about numbers, and stories give them that hook they're looking for.
Dude, AI-powered analytics are absolutely everywhere right now. Real-time streaming stuff is blowing up since companies want those instant insights. Edge computing's pretty cool too - you process data right where it happens instead of sending it all to the cloud first. Honestly, augmented analytics tools are game-changers because suddenly anyone can dig into data without being super technical. That's wild if you think about it. Privacy stuff like differential privacy is getting bigger too, which makes sense. I'd probably start with automated insights if I were you - seems most relevant to what you're doing now. Though real-time analytics might be more fun to play with.
-
Enough space for editing and adding your own content.
-
Enough space for editing and adding your own content.
-
The content is very helpful from business point of view.
-
Editable templates with innovative design and color combination.
-
Easily Understandable slides.