

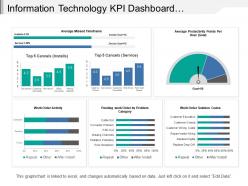
Information technology kpi dashboard showing work order activity





Try Before you Buy Download Free Sample Product
 Impress Your
Audience
 100%
Editable
 Save Hours
of Time


Avoid flip-flops with our Information Technology Kpi Dashboard Showing Work Order Activity. Keep advancing steadily ahead.
People who downloaded this PowerPoint presentation also viewed the following :
Information technology kpi dashboard showing work order activity with all 6 slides:
Create harmonious groups with our Information Technology Kpi Dashboard Showing Work Order Activity. Eradicate any feelings of distrust.


FAQs for Information technology kpi dashboard showing
Work order KPI dashboards should include completion rate, average resolution time, first-time fix rate, technician productivity, cost per work order, and customer satisfaction scores. These metrics enable organizations to streamline maintenance operations, optimize resource allocation, and enhance service delivery, with many manufacturing and facilities management teams finding that comprehensive tracking ultimately delivers improved operational efficiency and reduced downtime costs.
A work order KPI dashboard improves operational efficiency by providing real-time visibility into maintenance schedules, resource allocation, completion rates, and bottlenecks across operations. Through automated tracking and analytics, organizations streamline workflow management, reduce equipment downtime, and optimize technician productivity, with manufacturing facilities and service companies finding that centralized monitoring ultimately delivers faster response times and significantly lower operational costs.
**INPUT**: What software tools are best suited for creating a work order KPI dashboard? **OUTPUT**: Leading software tools for work order KPI dashboards include Tableau, Power BI, Qlik Sense, ServiceNow, and Smartsheet, each offering robust visualization and real-time tracking capabilities. These platforms streamline maintenance operations by automating data collection, enhancing resource allocation, and delivering actionable insights, with manufacturing and facilities management organizations finding that integrated dashboards ultimately reduce downtime and improve operational efficiency.
Data visualization enhances work order KPI understanding by transforming complex metrics into clear charts, graphs, and dashboards that reveal patterns, trends, and bottlenecks instantly. Through interactive visualizations, maintenance teams can quickly identify equipment performance issues, resource allocation gaps, and completion rate variations, while executives gain strategic insights into operational efficiency and cost optimization opportunities.
Real-time data enables immediate visibility into work order status, completion rates, resource utilization, and bottlenecks, allowing managers to make informed decisions quickly. Through live dashboards, organizations can identify delays, reallocate resources, and optimize workflows instantly, with many manufacturing and facilities management companies finding that real-time monitoring reduces response times and enhances operational efficiency.
Historical data enhances future work order decision-making by revealing patterns in equipment failures, maintenance costs, and resource allocation trends. Through predictive analytics, organizations can anticipate maintenance needs, optimize scheduling, and reduce downtime, with many manufacturing and facilities management companies finding that data-driven approaches deliver significantly lower operational costs and improved asset reliability.
Common challenges include data integration from multiple systems, ensuring real-time accuracy, defining relevant KPIs, user adoption resistance, and maintaining dashboard performance as operations scale. These implementation hurdles can be addressed through strategic planning, stakeholder engagement, and phased rollouts, with many organizations finding that investing in proper change management and training ultimately delivers enhanced operational visibility and improved decision-making capabilities.
Work orders can be categorized by priority level, asset type, maintenance category, department, cost range, and completion timeframe to enable targeted KPI tracking. This strategic categorization allows organizations to monitor specific metrics like emergency response times, preventive maintenance efficiency, and resource allocation across different operational areas, ultimately delivering clearer performance insights and improved maintenance planning.
Service level metrics for completed work orders include first-time fix rates, customer satisfaction scores, response time adherence, resolution time efficiency, and quality audit results. These measurements enable organizations to streamline operations, enhance customer experiences, and optimize resource allocation, with many service-oriented businesses finding that comprehensive tracking ultimately delivers improved competitive advantage and operational transparency.
The optimal frequency depends on operational pace, stakeholder needs, and data criticality, typically ranging from real-time updates for urgent repairs to weekly summaries for strategic planning. Manufacturing facilities often use hourly updates for equipment downtime tracking, while service organizations find daily refreshes sufficient, with many companies discovering that matching update frequency to decision-making cycles ultimately delivers better resource allocation and faster response times.
User accessibility in work order KPI dashboards ensures all team members, regardless of technical expertise or physical abilities, can effectively interpret critical maintenance data, make informed decisions, and respond quickly to operational needs. When dashboards feature intuitive interfaces, clear visualizations, and mobile compatibility, organizations streamline communication across departments, reduce response times, and ultimately enhance operational efficiency while maximizing their maintenance management investment.
Cross-departmental collaboration significantly enhances work order KPI effectiveness by improving data accuracy, reducing response times, and streamlining resource allocation across operations, maintenance, and procurement teams. When departments share real-time information and coordinate workflows, organizations achieve better asset utilization, faster issue resolution, and more accurate performance metrics, ultimately delivering improved operational efficiency and reduced downtime costs.
Work order KPIs directly influence overall business performance by measuring operational efficiency, resource utilization, cost control, and customer satisfaction across maintenance and service operations. These metrics enable organizations to identify bottlenecks, optimize workflows, and reduce downtime, with many manufacturing and facilities management companies finding that improved work order performance translates into enhanced productivity and competitive advantage.
Employee feedback can be integrated through surveys, focus groups, user interviews, and pilot testing sessions to identify relevant metrics and usability preferences. This collaborative approach ensures the dashboard addresses real operational challenges, with many maintenance teams finding that employee-driven KPI selection enhances adoption rates, improves data accuracy, and ultimately delivers more actionable insights for strategic decision-making.
Effective work order KPI dashboard utilization requires training in data interpretation, dashboard navigation, performance metric analysis, and actionable insight generation. Teams benefit from hands-on workshops covering trend identification, threshold setting, and reporting protocols, with maintenance, operations, and management personnel finding that structured training programs enhance decision-making speed, improve resource allocation accuracy, and ultimately deliver measurable operational efficiency gains.
-
Excellent template with unique design.
-
Easily Editable.