

Intel corporation competitors financial comparison 2018





Try Before you Buy Download Free Sample Product
 Impress Your
Audience
 100%
Editable
 Save Hours
of Time


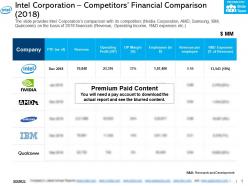
The slide provides Intel Corporations comparison with its competitors Nvidia Corporation AMD Samsung IBM Qualcomm on the basis of 2018 financials Revenue Operating Income R and D expenses etc.
People who downloaded this PowerPoint presentation also viewed the following :
Intel corporation competitors financial comparison 2018 with all 2 slides:
Ensure every individual actually gets included with our Intel Corporation Competitors Financial Comparison 2018. Bring alienation to an end.

FAQs for Intel corporation competitors
Intel Corporation generated approximately $71 billion in revenue during 2018, while main competitors included Samsung with $244 billion, TSMC with $34 billion, AMD with $6.5 billion, and NVIDIA with $11.7 billion in total revenues. These figures demonstrate the competitive landscape across semiconductors, memory, and processors, with companies leveraging different market segments and manufacturing capabilities to deliver varied revenue outcomes and strategic positioning.
Intel dominated the CPU market with approximately 80% share compared to AMD's 20% in 2018, while NVIDIA led the discrete GPU market with around 70% share versus AMD's 30%. These market positions reflected Intel's stronghold in processors for servers, laptops, and desktops, while NVIDIA's graphics leadership in gaming and emerging AI applications delivered significant competitive advantages in high-growth segments.
Intel reported a gross profit margin of approximately 62% and net profit margin of 23% in 2018, while AMD achieved a gross margin of 38% with a net margin of 3%. NVIDIA delivered the highest gross margin at 64% and net margin of 32%, reflecting their dominant position in high-performance graphics and AI chips, with all three companies benefiting from strong demand across data centers and gaming markets.
Intel led R&D spending in 2018 with approximately $13.5 billion, significantly outpacing AMD's $1.4 billion and NVIDIA's $2.8 billion, reflecting Intel's broader product portfolio and manufacturing capabilities. These investment levels demonstrate each company's strategic focus, with Intel emphasizing manufacturing innovation and diversification, while AMD and NVIDIA concentrated resources on targeted high-performance computing and graphics technologies.
**INPUT**: What were the key product launches from Intel's competitors in 2018 that impacted market dynamics? **OUTPUT**: Key competitive launches included AMD's second-generation Ryzen processors, NVIDIA's RTX 20-series GPUs with ray tracing, ARM's Cortex-A76 architecture, and Qualcomm's Snapdragon 855 mobile chipset. These innovations intensified competition by delivering enhanced performance, energy efficiency, and specialized capabilities across consumer, enterprise, and mobile segments, ultimately forcing accelerated innovation cycles and more competitive pricing strategies industry-wide.
Intel's stock declined approximately 2.4% in 2018, underperforming key competitors like NVIDIA which gained around 31% and AMD which rose roughly 79%, while also lagging broader semiconductor indices. This performance gap reflected investor concerns about Intel's manufacturing delays and competitive pressures in data center and GPU markets, ultimately highlighting the increasingly dynamic nature of semiconductor competition.
Intel's 2018 revenue growth was primarily driven by strong data center demand, cloud computing expansion, artificial intelligence workloads, and memory chip performance improvements. These factors enabled Intel to capitalize on enterprise digital transformation initiatives, 5G infrastructure investments, and IoT deployments across manufacturing, automotive, and telecommunications sectors, ultimately delivering enhanced market positioning despite increasing competitive pressures.
Geographical diversification significantly enhanced Intel and competitors' financial resilience in 2018 by spreading revenue across multiple regions, reducing dependency on single markets, and leveraging regional growth opportunities. Companies with strong Asia-Pacific presence, particularly in China and emerging markets, delivered superior revenue growth and margin stability, while those overly concentrated in mature markets faced constraints, ultimately providing diversified firms with competitive advantages through balanced risk exposure and access to high-growth segments.
**INPUT**: What was the impact of tariffs and trade policies on Intel and its competitors' finances in 2018? **OUTPUT**: Tariffs and trade policies in 2018 created mixed financial impacts across semiconductor companies, with Intel experiencing supply chain cost increases while competitors like AMD and NVIDIA faced similar margin pressures from component sourcing disruptions. These trade tensions ultimately drove strategic shifts toward supply chain diversification and regional manufacturing investments, with many chipmakers finding that operational flexibility and geographic distribution became increasingly critical competitive advantages in navigating global policy uncertainties.
Intel dominated with $70.8 billion revenue, $48.1 billion gross income, and $21.1 billion net income in 2018, significantly outpacing AMD's $6.5 billion revenue and $1.5 billion gross income, while NVIDIA generated $11.7 billion revenue with strong margins. Intel's scale advantage delivered substantially higher absolute profits, though competitors showed impressive growth rates in emerging markets.
Emerging technologies significantly influenced 2018 financial performance through revenue diversification, market positioning, and growth acceleration across semiconductor competitors. Companies like NVIDIA leveraged AI chip demand for data centers and automotive applications, while Qualcomm capitalized on IoT connectivity solutions and Intel expanded cloud infrastructure services, ultimately delivering competitive advantages and opening new revenue streams in rapidly expanding technology sectors.
Intel's 2018 operating expenses were $13.5 billion, AMD's were $1.4 billion, and NVIDIA's reached $2.8 billion, directly impacting their respective profit margins and operational efficiency. These expense structures reflect each company's scale and investment strategies, with Intel's higher absolute spending enabling broader R&D capabilities while AMD's leaner approach delivered improved cost efficiency, ultimately positioning each competitor differently in semiconductor market segments.
Intel's market capitalization in 2018 significantly exceeded both AMD and NVIDIA, with Intel valued at approximately $215 billion compared to AMD's $19 billion and NVIDIA's $108 billion. This substantial gap reflected Intel's dominant position in the CPU market and diversified revenue streams, though NVIDIA's strong growth in AI and gaming sectors, along with AMD's competitive processor launches, increasingly challenged Intel's market leadership and pricing power.
Intel faced significant challenges in 2018 including manufacturing delays in transitioning to 10-nanometer processors, intense competition from AMD's Ryzen and EPYC processors, and supply shortages in PC processors that constrained revenue growth. These operational difficulties, combined with increased R&D spending and competitive pressure in data center markets, ultimately impacted profit margins and market share, with many analysts noting Intel's struggle to maintain its traditional manufacturing advantage in an increasingly competitive semiconductor landscape.
Competitive pricing strategies in 2018 challenged Intel's premium positioning as AMD's aggressive Ryzen pricing and improved performance created significant market pressure, forcing Intel to reduce prices on several processor lines. While Intel maintained leadership in high-end server markets, AMD's value proposition gained substantial desktop and enterprise market share, with many system builders finding that AMD's price-performance ratio delivered compelling alternatives, ultimately requiring Intel to accelerate innovation timelines.
No Reviews