

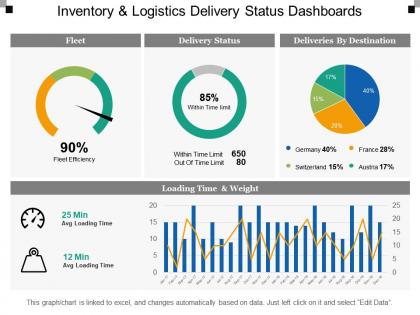
Inventory and logistics delivery status dashboards




Try Before you Buy Download Free Sample Product
 Impress Your
 Audience
 100%
100% Editable
 Save Hours
 of Time


Our Inventory And Logistics Delivery Status Dashboards cover your back. They ensure you move confidently forward.
People who downloaded this PowerPoint presentation also viewed the following :
Inventory and logistics delivery status dashboards with all 6 slides:
Devise the best combination with our Inventory And Logistics Delivery Status Dashboards. Your thoughts get grouped correctly.
FAQs for Inventory and logistics
Start with inventory turnover ratio and stockout frequency - those are your bread and butter metrics. Carrying costs matter too, plus order fulfillment times. Days sales outstanding is huge but so many people overlook it. Same with supplier lead times. Reorder point accuracy will save you headaches down the road. Warehouse utilization rates give you the bigger picture. Oh, and forecast accuracy - that one's critical since it affects literally everything else. Honestly, I'd focus on these eight first. You can always pile on more later once you figure out what's actually breaking in your day-to-day operations.
Dude, you know those annoying moments when your dashboard says you're stocked up but you're actually about to run dry? Real-time integration fixes that completely. Your systems talk instantly, so you'll see actual inventory numbers, live demand shifts, and get pinged the second something goes wrong in your supply chain. Making decisions with yesterday's data is honestly just painful at this point. The best part? You catch problems early - like if a supplier's running late, you have time to scramble for backup options. I'd start by hooking up your most critical stuff first, then build out.
Honestly, visual dashboards are a game changer for inventory stuff. Instead of staring at endless spreadsheet rows (ugh), you can actually see what's happening. Trends jump out immediately. Same with bottlenecks and weird outliers. Your brain just processes charts way faster than numbers - it's wild how much clearer everything becomes. Heat maps are perfect for flagging which products need urgent attention. And when you're explaining things to your boss or whoever, visuals make you look like you actually know what you're talking about. Start simple though - basic bar charts for stock levels, maybe some trend lines. You'll get hooked.
Honestly, these dashboards are a game changer - you get real-time stock data, sales patterns, supplier timing, everything in one spot. No more drowning in Excel hell (seriously, never again). Quick glance tells you what's selling fast vs what's just taking up space. Historical trends help predict those crazy holiday rushes too. Best feature? Auto-reorder points based on actual demand instead of wild guessing. Oh, and focus on your top 20% products first - that's where the real money impact happens. Way easier to manage cash flow when you can actually see what's moving.
Honestly, cloud inventory dashboards are pretty solid. Your team gets real-time data whether they're at their desk or stuck in traffic (which happens way too often these days). Everything connects smoothly - your ERP, warehouse systems, suppliers. No servers to babysit or updates to stress about. Scales automatically when you grow, which is nice. Way cheaper upfront since you're not dropping cash on hardware. I'd definitely test it out with a small pilot first though. See how it plays with your current stuff before committing fully.
Start with your biggest daily headaches - that's what should drive your dashboard setup. Most platforms are pretty flexible, so you can drag widgets around and set up custom alerts for whatever matters most. A food distributor's gonna track expiration dates and cold chain stuff, but if you're selling electronics? Focus on which SKUs are moving and seasonal trends instead. Think about what decisions you're making every day - those metrics deserve the top spots on your dashboard. The whole drag-and-drop thing makes it way easier than it used to be, honestly.
Honestly, start with real-time visibility - you need dashboards that actually fit how your team operates. Automated alerts are clutch when stock gets low. Mobile access is pretty much non-negotiable these days since you're not always at your desk. Integration with your current systems matters way more than people think (trust me on this one). Forecasting tools will save your butt by predicting demand spikes. Make sure reporting lets you view data from different angles too. Oh and definitely test 2-3 options with your real data before committing to anything.
Looking back at your sales data is honestly a game-changer for inventory. You'll catch seasonal patterns you'd never notice otherwise - like how winter boots always spike in October, not November like you'd expect. Pull at least 12-18 months of history to find reliable trends. This lets you restock before you're actually empty and dial in the right safety stock amounts. Best part? You avoid tying up cash in stuff that just sits there, plus you won't lose sales from being out of stock. It's way better than guessing.
Honestly, the hardest part is not drowning people in data. You'll have like 50 different metrics but users just want the key stuff fast. Different teams need totally different dashboards too - what works for warehouse ops won't work for executives. Integration is a nightmare when you're pulling from systems that hate each other. Real-time updates? Good luck if you're stuck with some ancient WMS from 2015 (been there). Performance gets sketchy with huge datasets. My take: figure out the 3 questions your users ask most and nail those first. Everything else can wait.
So these dashboards basically let everyone see what's actually happening with your inventory in real time - warehouse stock, shipments, how suppliers are doing, all that stuff. Instead of everyone guessing or passing around random spreadsheets (which is honestly a nightmare), your partners and vendors can just look at the same data you're seeing. Makes it way easier to catch problems early and fix them together. Your suppliers can even peek at your inventory levels and adjust their production accordingly - pretty smart, right? I'd start by figuring out what metrics your key partners actually care about, then give them access to those specific views.
Dude, get the mobile app ASAP. You'll stop sprinting back to your computer every five minutes just to check stock levels. Real-time data on your phone means you can spot problems and fix them right there on the warehouse floor. Response times drop like crazy - I've heard around 40% faster, which honestly makes sense. Plus coordinating with other teams becomes way smoother when you're not desk-bound. Oh, and use it during your floor walks to pull up dashboards. Game changer for staying on top of things without being chained to one spot all day.
So I'd add forecast widgets to your dashboard - stuff like demand predictions and reorder alerts. Tableau and Power BI both let you plug in ML models that crunch your historical data. The automated alerts are honestly a game changer when it's about to predict stockouts. Way better than scrambling last minute. Oh, and definitely show confidence intervals so you know if a forecast is solid or just guessing. I'd start with demand forecasting for your bestsellers first, then build out from there once you get the hang of it.
Start with automated validation rules that catch errors before they screw everything up. Weekly spot checks against your actual physical counts are a lifesaver. Honestly, manual data entry is where everything falls apart - get your barcode scanning and RFID syncing properly with the dashboard. Someone needs to own each data stream or it'll be chaos. Oh, and set up alerts when numbers look crazy compared to what you'd normally see. That way you can jump on weird stuff right away instead of finding out later when it's too late.
Dude, just hook up your WMS and ERP systems to pull data automatically - it'll save you so much time. Set up API feeds for real-time inventory and sales updates. Honestly, barcode scanning changed my life for tracking physical stuff. RFID works too but can get pricey. The key is figuring out what manual entry tasks eat up most of your day, then finding integrations for those first. Your dashboards will stay current without you constantly updating them, plus no more typos from rushed data entry.
Honestly, inventory dashboards are perfect for catching slow-moving stuff. They show you turnover rates and which items are just sitting there collecting dust. Set alerts for anything that hasn't moved in 30, 60, or 90 days - trust me, you'll be surprised what you find. The heat maps actually look pretty cool too, which is random but whatever. You can also spot trends that show when products are about to become obsolete. Weekly reviews help, and definitely set up automatic discounts before items turn into complete dead weight taking up space.
No Reviews