

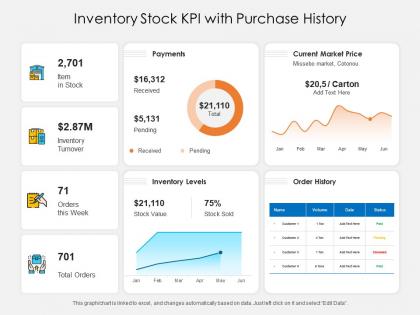
Inventory stock kpi with purchase history




Try Before you Buy Download Free Sample Product
 Impress Your
 Audience
 100%
100% Editable
 Save Hours
 of Time


Our Inventory Stock KPI With Purchase History are topically designed to provide an attractive backdrop to any subject. Use them to look like a presentation pro.
People who downloaded this PowerPoint presentation also viewed the following :
Inventory stock kpi with purchase history with all 2 slides:
Use our Inventory Stock KPI With Purchase History to effectively help you save your valuable time. They are readymade to fit into any presentation structure.
FAQs for Inventory stock kpi
Critical inventory turnover KPIs include inventory turnover ratio, days sales outstanding, stockout frequency, carrying cost percentage, and gross margin return on investment. These metrics streamline operations by identifying slow-moving stock, optimizing reorder points, and minimizing storage costs, with many retailers and manufacturers finding that strategic KPI monitoring ultimately delivers reduced waste and enhanced cash flow.
Businesses can effectively utilize Inventory Days on Hand by establishing industry-specific benchmarks, monitoring seasonal trends, and implementing automated reorder points based on historical data. This metric enables companies to balance carrying costs with stockout risks, with retail and manufacturing organizations finding that regular analysis streamlines purchasing decisions, reduces excess inventory, and ultimately delivers improved cash flow while maintaining optimal service levels.
Fill Rate KPI measures the percentage of customer orders fulfilled completely from available inventory, serving as a direct indicator of both customer satisfaction and supply chain performance. This metric enables retailers, manufacturers, and distributors to identify stockout patterns, optimize inventory levels, and enhance order fulfillment processes, ultimately delivering improved customer experiences and operational efficiency.
Companies leverage Carrying Cost of Inventory as a financial health metric by tracking storage expenses, insurance costs, obsolescence risks, and capital tied up in stock. This metric reveals operational efficiency and cash flow management effectiveness, with retailers and manufacturers finding that lower carrying costs indicate streamlined inventory processes, better demand forecasting, and improved working capital allocation, ultimately delivering enhanced profitability and competitive advantage.
Stockout Rate significantly impacts sales by creating immediate revenue loss and missed opportunities, while simultaneously eroding customer loyalty through poor experiences and reduced trust. High stockout rates force customers to competitors, decrease repeat purchases, and damage brand reputation, with many retailers finding that even brief stockouts can result in permanent customer defection and long-term revenue decline.
Businesses determine optimal reorder points by calculating Lead Time Demand through multiplying average daily usage by supplier lead time, then adding safety stock buffers for demand variability. Through this KPI, companies in manufacturing, retail, and healthcare sectors minimize stockouts while reducing carrying costs, with many organizations finding that automated reorder systems using real-time Lead Time Demand data streamline operations and enhance customer satisfaction.
Strategies to improve GMROI include optimizing product mix by focusing on high-margin, fast-moving items, implementing dynamic pricing models, reducing carrying costs through better demand forecasting, and streamlining supplier relationships. Retailers and manufacturers increasingly find that combining inventory analytics with automated reordering systems delivers faster turnover rates and enhanced profitability, ultimately maximizing returns per inventory dollar invested.
Inventory Accuracy KPI helps reduce shrinkage by identifying discrepancies between recorded and actual stock levels, enabling targeted loss prevention measures, cycle count optimization, and tighter inventory controls. Through real-time tracking and systematic variance analysis, organizations streamline warehouse operations, minimize carrying costs, and enhance supply chain visibility, with many retailers and manufacturers finding that improved accuracy ultimately delivers reduced operational expenses and better customer service levels.
Cycle Count Accuracy enhances inventory control by providing real-time visibility into stock levels, identifying discrepancies before they impact operations, and enabling proactive adjustments to prevent stockouts or overstock situations. Through systematic counting processes, organizations streamline warehouse operations, reduce carrying costs, and improve demand forecasting accuracy, ultimately delivering enhanced customer satisfaction and operational efficiency.
**INPUT**: How does the Backorder Rate affect a company's reputation and customer retention metrics? **OUTPUT**: High backorder rates significantly damage customer trust and loyalty by creating frustration, uncertainty, and perceptions of unreliability in service delivery. Companies with frequent backorders often experience increased customer churn, negative reviews, and reduced repeat purchases, with many retailers and manufacturers finding that even a 5% backorder rate can decrease customer retention by 15-20%, ultimately impacting long-term revenue growth. [Word count: 60]
Analyzing Slow-Moving Inventory KPI reveals cash flow inefficiencies, demand forecasting gaps, product lifecycle patterns, and storage cost burdens that impact profitability. This analysis enables organizations to optimize procurement strategies, identify discontinuation candidates, and reallocate resources toward faster-moving products, with many retailers and manufacturers finding that proactive slow-inventory management significantly enhances working capital efficiency.
Businesses can use the Inventory Turnover Ratio to identify demand trends by analyzing turnover rates across different time periods, product categories, and seasonal cycles, revealing which items move quickly or slowly. This analysis enables retailers and manufacturers to optimize stock levels, adjust procurement strategies, and enhance product mix decisions, with many organizations finding that consistent monitoring delivers improved cash flow and reduced carrying costs.
JIT inventory strategy delivers reduced carrying costs, minimized waste, improved cash flow, enhanced supplier relationships, and streamlined operations through KPI-driven demand forecasting and lead time optimization. Manufacturing companies and retailers leveraging JIT report 20-30% lower inventory costs while maintaining service levels, ultimately enabling faster market responsiveness and competitive advantage in increasingly dynamic supply chains.
Dead Stock Ratio identifies slow-moving inventory that ties up capital and storage space, enabling strategic markdown timing and liquidation decisions. By analyzing this metric, retailers can implement targeted clearance strategies, optimize pricing models, and reallocate resources toward high-performing products, ultimately minimizing losses and improving cash flow while maintaining competitive inventory turnover rates.
Combining qualitative and quantitative KPIs in inventory management delivers comprehensive visibility by balancing measurable metrics like turnover rates and stockout frequency with subjective assessments of supplier relationships and customer satisfaction. This strategic approach enables organizations to optimize operational efficiency while maintaining service quality, with many retailers and manufacturers finding that integrated KPI frameworks enhance decision-making accuracy and ultimately drive competitive advantage.
-
Good research work and creative work done on every template.
-
The Designed Graphic are very professional and classic.